
- Title
-
MicroRNA-mediated control of developmental lymphangiogenesis
- Authors
- Jung, H.M., Hu, C.T., Fister, A.M., Davis, A.E., Castranova, D., Pham, V.N., Price, L.M., Weinstein, B.M.
- Source
- Full text @ Elife
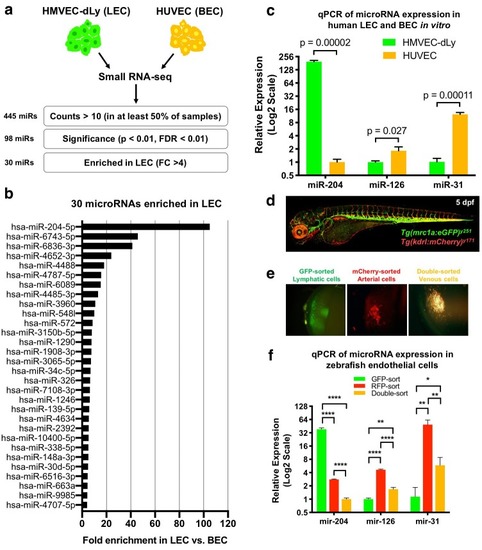
Quantitative TaqMan RT-PCR measurement of the relative expression of known lymphatic and blood vessel markers in HMVEC-dLy (Lymphatic Endothelial Cells, LEC) and HUVEC (Blood Endothelial Cells, BEC), normalized to expression levels in HMVEC-dLy (LEC). Four biological replicates were analyzed. All graphs are analyzed by t-test and the mean ± SD is shown. EXPRESSION / LABELING:
|
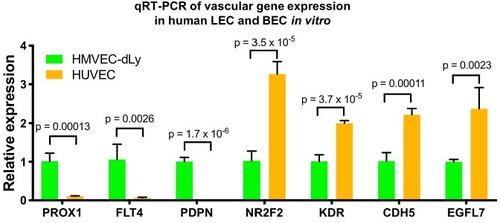
Quantitative TaqMan RT-PCR measurement of the relative expression of known lymphatic and blood vessel markers in HMVEC-dLy (Lymphatic Endothelial Cells, LEC) and HUVEC (Blood Endothelial Cells, BEC), normalized to expression levels in HMVEC-dLy (LEC). Four biological replicates were analyzed. All graphs are analyzed by t-test and the mean ± SD is shown. |
( |

( |
( |

( PHENOTYPE:
|
( PHENOTYPE:
|
( PHENOTYPE:
|

( PHENOTYPE:
|
( |
( EXPRESSION / LABELING:
PHENOTYPE:
|
( |
( PHENOTYPE:
|
( PHENOTYPE:
|
( PHENOTYPE:
|