
- Title
-
Anterior Trunk Muscle Shows Mix of Axial and Appendicular Developmental Patterns
- Authors
- Sagarin, K.A., Redgrave, A.C., Mosimann, C., Burke, A.C., Devoto, S.H.
- Source
- Full text @ Dev. Dyn.

The PHM primordium differs in the timing of gene expression from both the SHM and PFM. Anterior is to the left. Arrow: second lbx2 stream; arrowhead: PHM; dotted circle: PFM; dotted bracket: SHM. A‐D, lbx2 expression between 24 hours and 36 hours. A, dorsal view of lbx2 expression at 24 hours, with two distinct anterior streams of MMPs. B, dorsolateral view of lbx2 expression at 28 hours, with distinct anterior streams and dark ventral somite 5 (arrowhead). C, Dorsolateral view of lbx2 expression at 30 hours, expressed in SHM, PFM, and PHM. D, Dorsal view of lbx2 expression at 36 hours, expressed in SHM, PFM, and PHM. E‐H, myoD expression between 24 hours and 36 hours. E, Dorsal view of myoD expression at 24 hours is restricted to the somites (arrowhead). F, Dorsolateral view of myoD expression at 28 hours showing the earliest evidence of PHM. G, Dorsolateral view of myoD expression at 30 hours showing continued expression in the PHM and still no expression in the SHM or PFM. H, Dorsal view of myoD expression at 36 hours showing continued PHM differentiation, and early SHM and PFM differentiation. Scale bar is 100 μm |

PHM differentiation begins with slow fibers elongating distant from the somites and then growing anteriorly and posteriorly. Anterior is to the left. Embryos are in dorsolateral view. Dotted circle represents the position of the pectoral fin bud. A, myoD expression at 40 hours showing the relative location of the earliest PHM fibers. B‐D, Antibody labeling for S58 (slow myosin, green) and MF20 (all muscle myosin, magenta), arrowheads indicate the ends of the most recently formed muscle fibers at each stage, somite 4 and somite 5 are indicated (S4, S5). B, 40 hours Myosin at somites 2‐6 shows the first PHM fibers separate from the axial myotome. C, 44 hours Myosin at somites 1‐6 showing the PHM expanded anteriorly and posteriorly, and the second segment of the PHM forming at ventral somite 6. D, 48 hours Myosin at somites 1‐6 (S4 and S5 labeled) showing fiber striations and further expansion. Scale bar in A is 100 μm. Scale bar in D, for B to D, is 50 μm |
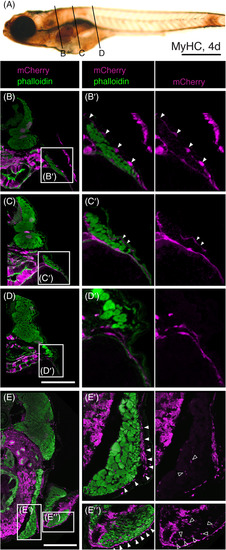
The PHM has superficial and internal mCherry‐positive connective tissue cells. A, Whole‐mount MyHC stain showing positions of sections shown in B‐D. B‐D, Transverse sections of regions indicated in A of Tg(drl:creERT2);Tg(ubi:Switch) embryos, labeled for mCherry (magenta) and phalloidin (green). mCherry expressing cells are derived from lateral plate mesoderm. B′‐E′, magnifications of boxed regions in B‐E. B‐B′, Section at the level of the anterior PHM. mCherry‐expressing cells are found along the entire superior surface of the PHM (arrowheads). C‐C′, Section through more posterior PHM. Weak mCherry expression is seen along a portion of the superior surface of the PHM (arrowheads). D‐D′, Section through trunk myotome. mCherry expression is absent from the surface of the trunk myotome. E‐E″, Transverse section at the level of the anterior PHM in a 9.3 mm juvenile. mCherry positive cells are found along the entire superficial surface of the PHM (closed arrowheads). mCherry expression is present between muscle fibers in the PHM and PFM (open arrowheads). Scale bar in A is 1 mm. Scale bar in D, for B‐D, is 100 μm. Scale bar in E is 500 μm |