
- Title
-
Ability of prebiotic polysaccharides to activate a HIF1α-antimicrobial peptide axis determines liver injury risk in zebrafish
- Authors
- Zhang, Z., Ran, C., Ding, Q.W., Liu, H.L., Xie, M.X., Yang, Y.L., Xie, Y.D., Gao, C.C., Zhang, H.L., Zhou, Z.G.
- Source
- Full text @ Commun Biol

High-fat diets induced hepatic steatosis in adult and larval zebrafish. a Body weight of adult zebrafish fed with a control diet or high-fat diet (HFD) for 4 weeks. b Representative image of the abdominal subcutaneous fatty tissue histology with H&E staining. The scale bar is 100 μm. cTriacylglyceride (TAG) content in liver (n = 3, pool of three zebrafish per sample). dRepresentative liver histology image by H&E staining. The scale bar is 50 μm. e The expression of lipid metabolism-related genes in liver (n = 5, pool of three zebrafish per sample). f Representative image of whole-mount oil red O staining and H&E staining of liver sections in larvae fed control diet and high-fat diet. The scale bar is 100 μm. g The expression of lipid metabolism-related genes in zebrafish larvae. Gene expression was analyzed using cDNA prepared from pools of larvae in each group after seven days of feeding (n = 3, pool of 20 larvae per sample). Significance was established using a two-tailed student’s t-test. Differences are considered significant at P < 0.05 (*) and P < 0.01 (**) EXPRESSION / LABELING:
PHENOTYPE:
|
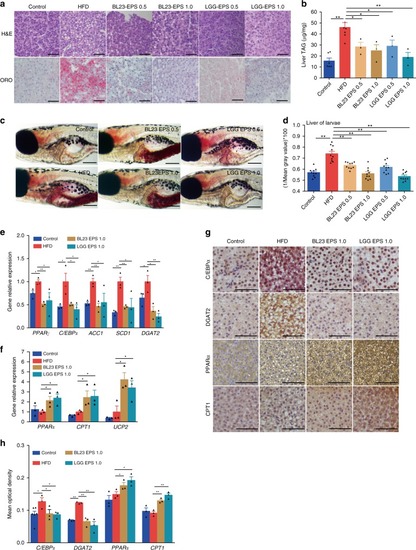
LGG EPS and BL23 EPS ameliorated the hepatic steatosis in high-fat diet-fed zebrafish. Adult zebrafish (1-month-old) were fed with the control diet, HF diet, or HF diet supplemented with 0.5% or 1% EPS for 4 weeks. a Representative liver histology images with oil red O staining and H&E staining. The scale bar is 50 μm. b Triacylglyceride contents in the liver (n = 3 or 6, pool of three zebrafish per sample). c Representative images of whole-mount oil red O staining of larvae fed control diet, high-fat diet, or high-fat diet supplemented with 0.5 or 1% EPS for one week. The scale bar is 200 μm. d Quantitative evaluation of hepatic steatosis in zebrafish larvae fed control diet, high-fat diet, or high-fat diet supplemented with 0.5 or 1% EPS for one week (n = 10). The ORO images in panel c were converted to 8-bit gray scale, and mean gray value was measured using ImageJ software to quantitatively evaluate hepatic steatosis. The expression of genes related to lipogenesis (e), energy expenditure (f), in livers as measured by q-PCR (n = 3, pool of three zebrafish per sample). g, h Immunohistochemical analysis and quantification of hepatic C/EBPα, DGAT2, PPARα, and CPT1 levels, the scale bar is 50 μm. Data were expressed as the mean ± SEM. Differences are considered significant at P < 0.05 (*) and P < 0.01 (**) EXPRESSION / LABELING:
PHENOTYPE:
|

ZFIN is incorporating published figure images and captions as part of an ongoing project. Figures from some publications have not yet been curated, or are not available for display because of copyright restrictions. EXPRESSION / LABELING:
PHENOTYPE:
|
|
ZFIN is incorporating published figure images and captions as part of an ongoing project. Figures from some publications have not yet been curated, or are not available for display because of copyright restrictions. EXPRESSION / LABELING:
PHENOTYPE:
|
|
ZFIN is incorporating published figure images and captions as part of an ongoing project. Figures from some publications have not yet been curated, or are not available for display because of copyright restrictions. EXPRESSION / LABELING:
PHENOTYPE:
|

HIF1α-AMP axis contributed to the microbial homeostasis associated with LGG EPS in high-fat diet-fed zebrafish. a The expression of genes related to hypoxia-inducible factors in the intestines of zebrafish fed with different diets for 4 weeks as measured by q-PCR (n = 6, pool of three zebrafish per sample). b A representative western blotting showing the expression pattern of Hif1α in the intestines. c Intestinal Hif1α levels evaluated by immunohistochemical analysis, the scale bar is 50 μm. Foxo3b-null zebrafish larvae (foxo3b−/−) and their wild-type siblings (foxo3b+/+) were fed 1.0% BL23 EPS diet for 7 days. The total bacteria (d) and the relative bacterial abundance of Proteobacteria (e), Fusobacteria (f), Plesiomonas (g), Cetobacterium (h) of the microbiota of the foxo3b-null larvae and their wild-type siblings (n = 3, pool of 20 larvae per sample). The expression pattern of genes related to AMPs i in foxo3b-null larvae and their wild-type siblings as measured by q-PCR (n = 4, pool of 20 larvae per sample). The adult zebrafish fed 1.0% LGG EPS for 2 weeks received intraperitoneal injection of YC-1 (an HIF-1α inhibitor; APExBIO, B7641) in dimethyl sulfoxide (DMSO) (2 mg/kg) once every 2 days for another 6 days. The expression of HIF-1α (j), and AMPs (k), in intestines as measured by q-PCR (n = 3 or 4, pool of three zebrafish per sample). l The number of total bacteria, Proteobacteria, and Fusobacteria in intestinal contents of zebrafish (n = 4 or 5). Serum ALT (m) and serum AST (n) in zebrafsh. o The expression of apoptotic factors in intestines as measured by q-PCR (n = 4–6, pool of three zebrafish per sample). p The expression of genes related to hypoxia-inducible factors as measured by q-PCR in germ-free larvae fed with sterile control diet, high-fat diet (HFD), or HFD supplemented with 1.0% BL23 EPS or LGG EPS for 1 week (n = 4, pool of 20 larvae per sample). Data are expressed as the mean ± SEM. Graph bars labeled with different letters on top represent statistically significant results (P < 0.05), whereas bars with the same letter indicates non-significant differences EXPRESSION / LABELING:
PHENOTYPE:
|
|
ZFIN is incorporating published figure images and captions as part of an ongoing project. Figures from some publications have not yet been curated, or are not available for display because of copyright restrictions. EXPRESSION / LABELING:
PHENOTYPE:
|
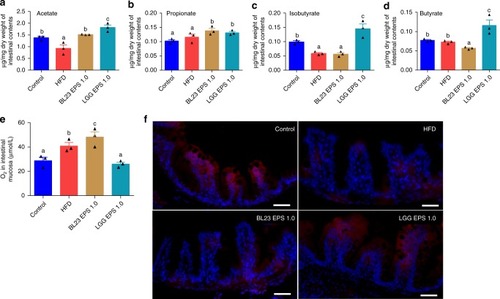
Butyrate further supported the differentiated state of microbiotas associated with LGG EPS or BL23 EPS. Adult zebrafish (1-month-old) were fed with the control diet, HF diet, or HF diet supplemented with 1.0% BL23 EPS or 1.0% LGG EPS for 4 weeks. Intestinal acetate levels (a), propionate levels (b), isobutyrate levels (c), butyrate levels (d) in zebrafish fed different diets which was performed with gas chromatography-mass spectrometry (n = 3). e The O2 concentration in the intestinal mucosa layer of zebrafish fed with different diets for 4 weeks (n = 3). fRepresentative images of hypoxyprobe immunostaining in the intestine of zebrafish fed with different diets for 4 weeks. The scale bar is 50 μm. Data are expressed as the mean ± SEM. Graph bars labelled with different letters on top represent statistically significant results (P < 0.05), whereas bars with the same letter corresponds to results that show no statistically significant differences PHENOTYPE:
|