
- Title
-
A Novel AURKA Mutant-Induced Early-Onset Severe Hepatocarcinogenesis Greater than Wild-Type via Activating Different Pathways in Zebrafish
- Authors
- Su, Z.L., Su, C.W., Huang, Y.L., Yang, W.Y., Sampurna, B.P., Ouchi, T., Lee, K.L., Wu, C.S., Wang, H.D., Yuh, C.H.
- Source
- Full text @ Cancers

ZFIN is incorporating published figure images and captions as part of an ongoing project. Figures from some publications have not yet been curated, or are not available for display because of copyright restrictions. |
|
ZFIN is incorporating published figure images and captions as part of an ongoing project. Figures from some publications have not yet been curated, or are not available for display because of copyright restrictions. |
|
ZFIN is incorporating published figure images and captions as part of an ongoing project. Figures from some publications have not yet been curated, or are not available for display because of copyright restrictions. |
|
ZFIN is incorporating published figure images and captions as part of an ongoing project. Figures from some publications have not yet been curated, or are not available for display because of copyright restrictions. |
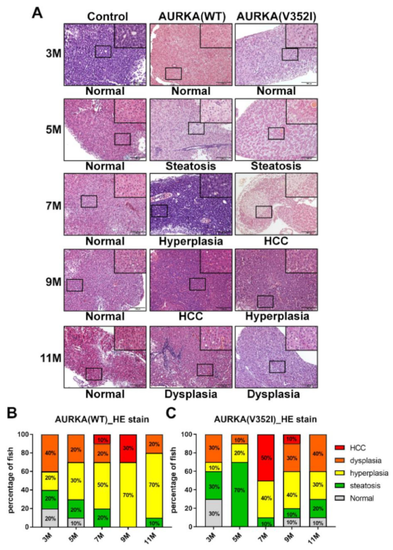
Hematoxylin and Eosin staining reveals that AURKA(V352I) dramatically promotes hepatocellular carcinoma (HCC) at 7 months, and AURKA(WT) promotes HCC at 9 months of age. (A) Representative images of HE staining in control, AURKA(WT) and AURKA(V352I) at 3, 5, 7, 9, and 11 months; (B,C) Statistical analysis of the AURKA(WT) and AURKA(V352I) HE stain results shown as percentage of fish displayed normal (gray), steatosis (green), hyperplasia (yellow), dysplasia (orange), and HCC (red) at different stages. PHENOTYPE:
|
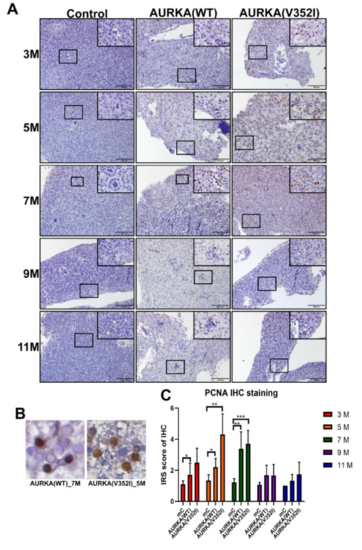
The immunoreactive score (IRS) of immunohistochemistry for the proliferating cell nuclear antigen (PCNA) was greater in AURKA(V352I) and AURKA(WT) than in control fish at 5 and 7 months. (A) Representative images of immunohistochemistry (IHC) staining for PCNA in control, AURKA(WT), and AURKA(V352I) at 3, 5, 7, 9, and 11 months; (B) Selected enlarged images show the nuclear signals of PCNA from AURKA(WT)—7 M and AURKA(V352I)—5 M; (C) Statistical analysis of PCNA immunostaining IRS score at 3, 5, 7, 9, and 11 months. IRS score of control fish (Tg(fabp10a:EGFP-mCherry) abbreviated as mC, AURKA(WT) and AURKA(V352I) is shown in red (3 M), orange (5 M), green (7 M), purple (9 M), and blue (11 M). Statistical analysis of results was performed using a two-tailed Student’s t-test. The error bar means standard deviation. Asterisks (*) represent the level of significance. * p-value ≤ 0.05; ** p-value ≤ 0.01; *** p-value ≤ 0.001. PHENOTYPE:
|

Immunoreactive score of immunohistochemistry for β-catenin reveals that AURKA(V352I) is significantly lower than control and AURKA(WT) at 3, 5, and 7 months. (A) Representative images of immunohistochemistry (IHC) staining for β-catenin in control, AURKA(WT) and AURKA(V352I) at 3, 5, 7, 9, and 11 months; (B) Statistical analysis of β-catenin immunostaining IRS score at 3, 5, 7, 9, and 11 months; (C) Statistical analysis of nuclear β-catenin immunostaining IRS score at 3, 5, 7, 9, and 11 months. IRS score of control fish (Tg(fabp10a:EGFP-mCherry) abbreviated as mC, AURKA(WT) and AURKA(V352I) is shown in red (3 M), orange (5 M), green (7 M), purple (9 M), and blue (11 M). Statistical analysis of results was performed using a two-tailed Student’s t-test. The error bar means standard deviation. Asterisks (*) represent the level of significance. * p-value ≤ 0.05; ** p-value ≤ 0.01; *** p-value ≤ 0.001. |

Immunoreactive score of the phosphatase and tensin homologues deleted on chromosome 10 (PTEN). Immunostaining reveals that PTEN shows no difference between control and AURKA transgenic zebrafish. (A) Representative images of immunohistochemistry (IHC) staining for PTEN in control, AURKA(WT), and AURKA(V352I) at 3, 5, 7, 9, and 11 months; (B) Selected enlarged images show the PTEN signals from AURKA(WT)—7 M and AURKA(V352I)—7 M; (C) Statistical analysis of PTEN immunostaining IRS score at 3, 5, 7, 9 and 11 months. IRS score of control fish (Tg(fabp10a:EGFP-mCherry) abbreviated as mC, AURKA(WT) and AURKA(V352I) is shown in red (3 M), orange (5 M), green (7 M), purple (9 M), and blue (11 M). Statistical analysis of results was performed using a two-tailed Student’s t-test. The error bar means standard deviation. |

Immunoreactive score of p-Akt immunostaining reveals that Akt is much more significantly activated in AURKA(V352I) than in AURKA(WT). (A) Representative images of p-AKT staining for PTEN in control, AURKA(WT), and AURKA(V352I) at 3, 5, 7, 9, and 11 months; (B) Selected enlarged images show the p-AKT signals from AURKA(WT)—11 M and AURKA(V352I)—11 M; (C) Statistical analysis of p-AKT immunostaining IRS score at 3, 5, 7, 9, and 11 months. The gray, orange, and blue colors represent control, AURKA(WT), and AURKA(V352I), respectively. Statistical analysis of results was performed using a two-tailed Student’s t-test. The error bar means standard deviation. Asterisks (*) represent the level of significance. * p-value ≤ 0.05; ** p-value ≤ 0.01; *** p-value ≤ 0.001. |

Immunoreactive score of phospho- mammalian target of the rapamycin (mTOR) (at Ser2448, inactive form) immunostaining for the AKT/mTOR pathway reveals that the expression of mTOR has no significant difference between control and AURKA transgenic fish. (A) Representative images of p-mTOR staining for PTEN in control, AURKA(WT), and AURKA(V352I) at 3, 5, 7, 9, and 11 months; (B) Selected enlarged images show the p-mTOR signals from AURKA(WT)—11 M and AURKA(V352I)—11 M; (C) Statistical analysis of p-mTOR immunostaining IRS score at 3, 5, 7, 9, and 11 months. IRS score of control fish (Tg(fabp10a:EGFP-mCherry) abbreviated as mC, AURKA(WT) and AURKA(V352I) is shown in red (3 M), orange (5 M), green (7 M), purple (9 M), and blue (11 M). Statistical analysis of results was performed using a two-tailed Student’s t-test. The error bar means standard deviation. Asterisks (*) represent the level of significance. * p-value ≤ 0.05. |