
- Title
-
Positive Feedback Defines the Timing, Magnitude, and Robustness of Angiogenesis
- Authors
- Page, D.J., Thuret, R., Venkatraman, L., Takahashi, T., Bentley, K., Herbert, S.P.
- Source
- Full text @ Cell Rep.

ZFIN is incorporating published figure images and captions as part of an ongoing project. Figures from some publications have not yet been curated, or are not available for display because of copyright restrictions. |
|
ZFIN is incorporating published figure images and captions as part of an ongoing project. Figures from some publications have not yet been curated, or are not available for display because of copyright restrictions. EXPRESSION / LABELING:
PHENOTYPE:
|
|
ZFIN is incorporating published figure images and captions as part of an ongoing project. Figures from some publications have not yet been curated, or are not available for display because of copyright restrictions. EXPRESSION / LABELING:
|
|
ZFIN is incorporating published figure images and captions as part of an ongoing project. Figures from some publications have not yet been curated, or are not available for display because of copyright restrictions. PHENOTYPE:
|
|
ZFIN is incorporating published figure images and captions as part of an ongoing project. Figures from some publications have not yet been curated, or are not available for display because of copyright restrictions. PHENOTYPE:
|
|
ZFIN is incorporating published figure images and captions as part of an ongoing project. Figures from some publications have not yet been curated, or are not available for display because of copyright restrictions. |
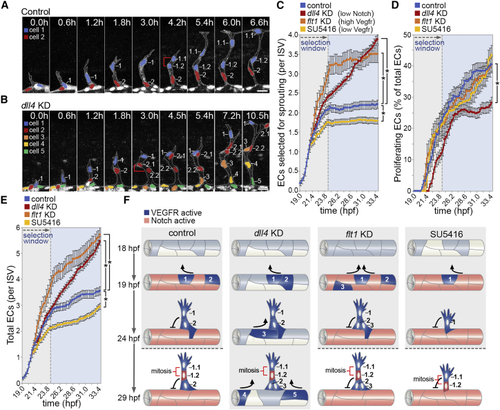
Switch-like Behavior of Motile EC Selection in Angiogenesis (A and B) Time-lapse images of EC nuclei in ISVs of control (A) and (C–E) Quantification of the number of ECs that are selected to branch (C), undergo proliferation (D), or the total number of ECs per ISV (E) in control, (F) Illustration of the biphasic nature of the selection of motile ECs in angiogenesis. Vegf signal levels define the number of ECs selected to branch, and Dll4-mediated LI prevents further selection of motile ECs. Increased Vegf ( Data are mean ± SEM. ∗p < 0.05, two-way ANOVA test. Scale bars, 25 μm. See also |

Identification of Putative Positive-Feedback Modulators of Vegf Signaling (A) Fold change in the indicated transcript levels by microarray following inhibition of Vegfr signaling (2.5 μM SU5416), Notch activity (100 μM DAPT), or both, from 22 to 30 hpf. (B and C) Fold change in (D) Illustration of the putative transcriptional regulation of (E) Lateral views of sprouting ISVs in (F) Whole-mount Data are mean ± SEM. Scale bar, 100 μm. See also |

TM4SF1/Tm4sf18 Expression Feeds Back to Amplify VEGF/Vegf Signaling (A) Relative expression levels of (B and C) Western blot analysis of pERK/ERK levels in HUVECs after VEGF-A stimulation following transfection with control or (D) Lesions introduced into the (E) Strategy for assessing Vegfr signaling dynamics (F–I) Lateral views of pErk immunostaining in ECs of WT (F) or Data are mean ± SEM. ∗p < 0.05, two-tailed t test. Scale bars, 25 μm. |
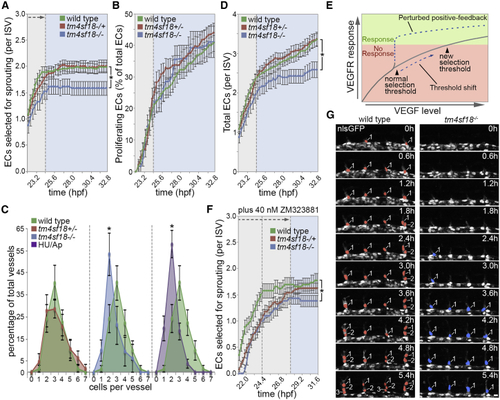
Tm4sf18 Modulates the Magnitude and Timing of the Angiogenic Response (A and B) Quantification of the number of ECs selected to branch (A) or the percentage of ECs that undergo proliferation (B) in WT, (C) Quantification of the distribution of ISV cellularity in WT, (D) Quantification of the total number of ECs per ISV in WT, (E) Predicted shift in the level of VEGF signaling required to achieve a selection threshold in the absence of positive feedback. (F and G) Quantification of the number of ECs selected to branch in 40 nM ZM323881-treated WT, Data are means ± SEM. ∗p < 0.05, two-way ANOVA or two-tailed t test. Scale bar, 25 μm. See also |
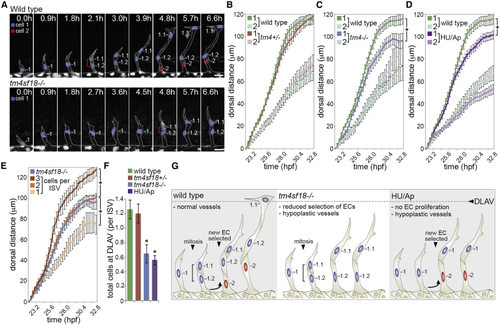
Hypocellular Vessels in (A) Time-lapse images of sprouting ISVs in WT and (B–D) Quantification of the dorsal movement of tip (cell 1) or stalk (cell 2) ECs in WT and (E) Quantification of the dorsal movement of tip ECs in non-proliferating ISVs consisting of 1, 2, and 3 or more ECs and comparison with the motility of tip ECs in (F) Quantification of the number of ECs that reach the DLAV position in WT, (G) Illustration of the causes of vessel hypoplasia and phenotypic effect on vessel extension. Data are means ± SEM. ∗p < 0.05, two-way ANOVA or two-tailed t test. Scale bars, 25 μm. See also |
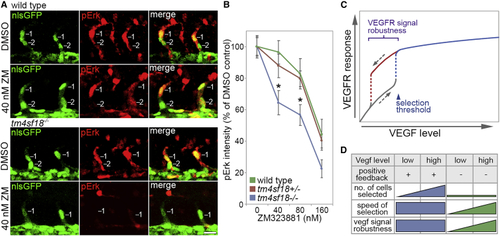
Robustness of Tip Identity Is Lost in (A) Lateral views of sprouting ECs in ISVs of WT and (B) Quantification of pErk fluorescence intensity in WT, (C) Putative role of positive-feedback-generated bistability and hysteretic dynamics in the control of VEGFR signal level robustness in angiogenesis. Bistability ensures that higher levels of VEGF are required to induce tip patterning than to reverse this active state, conferring robustness on tip identity against fluctuations in VEGF levels. (D) Impact of Tm4sf18-mediated positive feedback on the magnitude, speed, and robustness of motile EC selection during ISV branching. Tm4sf18 drives quick and robust decision making but also ensures delicate modulation of the magnitude of EC selection by Vegf levels. In the absence of Tm4sf18, the magnitude of EC selection is diminished, and both the speed and robustness of EC selection are highly variable and more dependent on Vegf level. Data are means ± SEM. ∗p < 0.05, two-way ANOVA or two-tailed t test. Scale bar, 25 μm. |