
- Title
-
HDAC1-mediated repression of the retinoic acid-responsive gene ripply3 promotes second heart field development
- Authors
- Song, Y.C., Dohn, T.E., Rydeen, A.B., Nechiporuk, A.V., Waxman, J.S.
- Source
- Full text @ PLoS Genet.
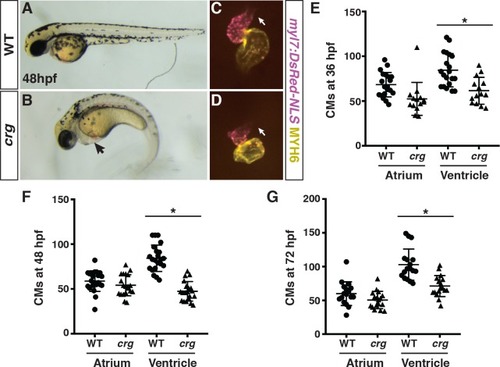
(A-B) WT sibling and EXPRESSION / LABELING:
PHENOTYPE:
|
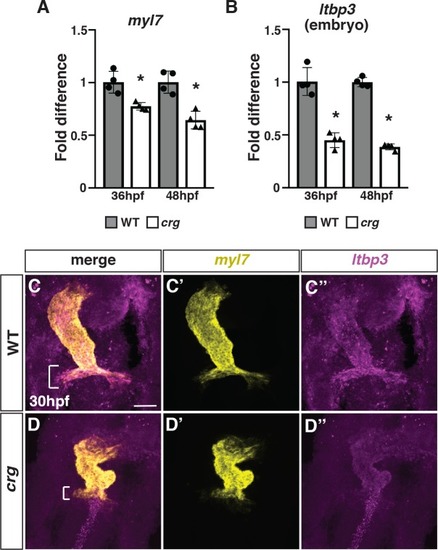
(A,B) RT-qPCR for the pan-cardiac differentiation marker |

(A-B”) Representative images of hearts from photoconverted WT sibling and |

(A-B”‘) Confocal images of IHC for hearts and Nkx2.5+ SHF progenitors in WT sibling and |
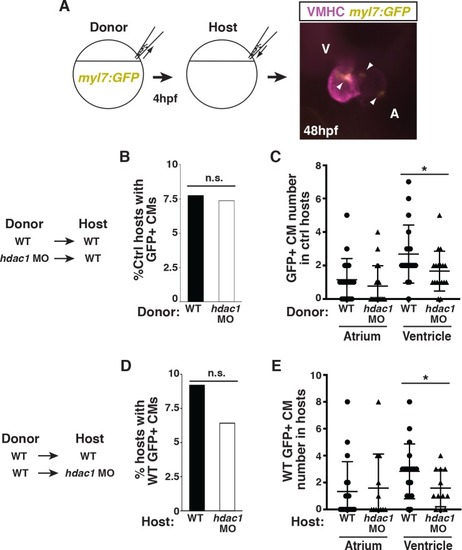
(A) Schematic of the blastula cell transplantation strategy. Vmhc (purple) indicates ventricle. Arrows indicate |

(A-D) RT-qPCR for EXPRESSION / LABELING:
PHENOTYPE:
|

(A,B) Control and transgenic |

ZFIN is incorporating published figure images and captions as part of an ongoing project. Figures from some publications have not yet been curated, or are not available for display because of copyright restrictions. |
|
ZFIN is incorporating published figure images and captions as part of an ongoing project. Figures from some publications have not yet been curated, or are not available for display because of copyright restrictions. |

CM specification and early differentiation are overtly unaffected in crg mutants.(A-D) ISH for CM specification markers gata4 and hand2 at the 8s stage. n = 5 WT and n = 5 crg mutants embryos examined. (E,F) ISH for the CM differentiation marker myl7 at the 20s stage. n = 10 WT and n = 5 crg mutants embryos examined. Views are dorsal with anterior up. |
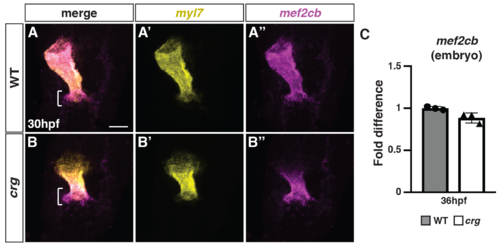
The SHF marker mef2cb has increased expression adjacent to differentiated CMs at the arterial pole of the heart in crg mutants.(A-B”) Two-color FISH for myl7 and mef2cb in WT sibling and crg mutant embryos at 30 hpf. Brackets in A and B indicate mef2cb at the arterial pole of in WT and crg mutant hearts, respectively. n = 5 WT and n = 5 crg mutants embryos examined. (C) RT-qPCR for the SHF marker mef2cb from embryos at 36 hpf. |
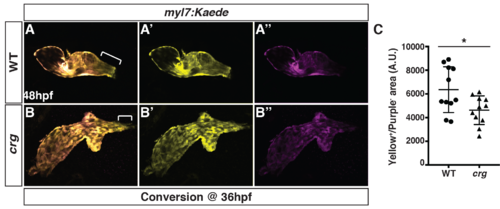
Later-differentiating VCs are reduced in crg mutants.(A-B”) Images of hearts from photoconverted WT sibling and crg mutant myl7:Kaede embryos at 48 hpf following photoconversion at 36 hpf. The arterial poles (brackets) are to the right. (C) Quantification of the area of later-differentiating VCs (Yellow+/Purple-). (n = 11 for WT and crgmutants). |
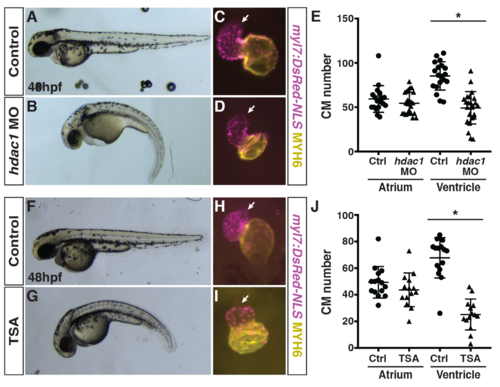
Hdac1 depletion and treatment with TSA produce similar phenotypes as crgmutants.(A,B) Control and Hdac1-depleted embryos at 48 hpf. Lateral views with anterior to the left. (C,D) Hearts from control and Hdac1-depleted myl7:NLS-DsRed2 embryos at 48 hpf. Frontal views. Purple alone indicates ventricle. Yellow indicates atrium. Arrows indicate arterial pole of the ventricle. (E) Quantification of CMs in the atria and ventricles of control and Hdac1-depleted myl7:NLS-DsRed2 embryos at 48 hpf (n = 19 for control and Hdac1-depleted embryos). (F,G) Control and TSA-treated embryos at 48 hpf. Lateral views with anterior to the left. (H,I) Hearts from control and TSA-treated myl7:NLS-DsRed2 embryos at 48 hpf. Frontal views. Purple alone indicates ventricle. Yellow indicates atrium. Arrows indicate arterial pole of the ventricle. (J) Quantification of CMs in the atria and ventricles of control and TSA-treated myl7:NLS-DsRed2 embryos at 48 hpf (n = 14 for both control and TSA-treated embryos). |

Expression of nkx2.5 and ripply3 in WT and crg mutants.(A-D”) Confocal images of two-color FISH for nkx2.5 and ripply3 in WT and crg mutant embryos at 30 and 36 hpf. Images are dorsal views with anterior up. Insets in A-D indicate lateral views of the confocal images. n = 10 WT and n = 9 crg mutants embryos for 30 hpf and n = 4 WT and n = 4 crg mutants embryos for 36 hpf examined. Scale bar is 100 μm. |
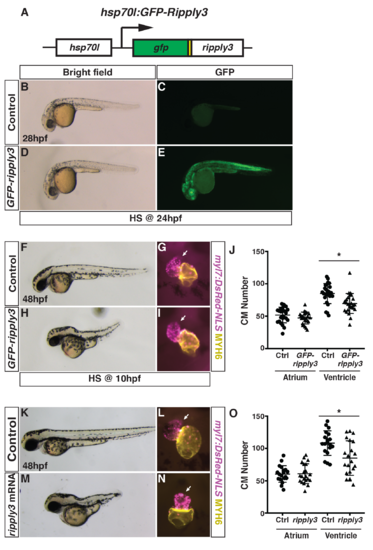
Generation and validation of the heat-shock inducible GFP-ripply3 transgenic line.(A) Schematic of the heat-shock inducible hsp70l:GFP-ripply3 transgene. (B-E) Heat-shock induction of GFP-ripply3 at 24 hpf. Control embryos are heat-shocked non-transgenic siblings. (F,H) Control and hsp70l:GFP-ripply3 embryos at 48 hpf following heat-shock at 10 hpf. Lateral views with anterior to the left. (G,I) Hearts from control and hsp70l:GFP-ripply3; myl7:NLS-DsRed2 embryos at 48 hpf following heat-shock at 10 hpf. Frontal views. Purple alone indicates ventricle. Yellow indicates atrium. Arrows indicate arterial pole of the ventricle. (J) Quantification of CMs from control and hsp70l:GFP-ripply3; myl7:NLS-DsRed2 embryos at 48 hpf following heat-shock at 10 hpf (n = 25 for control and GFP-ripply3+). (K,M) Control and ripply3 mRNA-injected embryos at 48 hpf. Lateral views with anterior to the left. (L,N) Hearts from control and ripply3 mRNA-injected myl7:NLS-DsRed2 embryos at 48 hpf. Frontal views. Purple alone indicates ventricle. Yellow indicates atrium. Arrows indicate arterial pole of the ventricle. (O) Quantification of CMs from control and ripply3 mRNA-injected myl7:NLS-DsRed2 embryos at 48 hpf (n = 21 for control and ripply3 mRNA-injected embryos). |

Generation of ripply3 mutants.(A) Schematic of the ripply3 exons and the gRNA targeting exon of the ripply3 gene. (B) The ripply3 mutant allele used deletes 61bp including the start codon. (C,D) WT sibling and ripply3mutants at 48 hpf. (E,F) Ripply3 transcripts are not detectable in ripply3 mutants at 30 hpf. Arrows indicate posterior pharyngeal region where ripply3 is expressed in WT embryos. Views are dorsal with anterior up. (G) RT-qPCR for ripply3 in ripply3 mutants at 36 hpf indicates the transcripts are essentially undetectable. Primers used do not bind within the deleted region. (H) Quantification of atrial CMs in crgwt+het; ripply3wt+het, crgwt+het; ripply3-/-, crg-/-; ripply3wt+het, and crg-/-; ripply3-/- embryos at 48 hpf (n = 37 for crgwt+het; ripply3wt+het, n = 10 for crgwt+het; ripply3-/-, n = 48 for crg-/-; ripply3wt+het, n = 18 for crg-/-; ripply3-/-). |