FIGURE SUMMARY
Title

Disruption of asxl1 results in myeloproliferative neoplasms in zebrafish

Authors
Gjini, E., Jing, C.B., Nguyen, A.T., Reyon, D., Gans, E., Kesarsing, M., Peterson, J., Pozdnyakova, O., Rodig, S.J., Mansour, M.R., Joung, K., Look, A.T.
Source
Full text @ Dis. Model. Mech.

Genome editing with use of transcription activator-like effector nucleases (TALENs) to generate null alleles of the zebrafish asxl1 gene. (A) Site-specific targeting for TALEN-directed Fok1 cleavage within exon 2. (B) Nucleotide sequence alignment of the asxl1Δ10 and asxl1Δ11 zebrafish lines compared to wild-type asxl1. Left, TALEN binding site appears in red; right, TALEN binding site appears in green. Dashes in the DNA sequence represent the nucleotides that are deleted during repair of Fok1-induced DNA double-stranded breaks. (C) Targeted Fok1-induced mutagenic lesions in asxl1 produce frameshift mutations that lead to truncated protein products following short regions of novel amino acids, which are indicated in purple. Red ‘X’ denotes stop codons. (D) The truncated Asxl1 protein products predicted to be expressed in the asxl1Δ10 and asxl1Δ11 mutant lines lack all highly conserved functional domains. Red asterisks denote stop codons. (E) asxl1−/− zebrafish larvae mutants appear shorter in length and slimmer than asxl1+/+ and asxl1+/ zebrafish larvae at day 7 and day 9 post-fertilization. Scale bars: 200 µm. (F) Kaplan–Meier survival curves for asxl1+/+, asxl1+/ and asxl1−/− mutants during the first 35 weeks of life. Asterisk (*) at the base of first curve indicates that ∼8% of asxl1−/− fish grow to normal size and survive.

Asxl1 loss affects organ development. Histopathological analysis of the muscle, intestine and liver development with hematoxylin and eosin staining in 5 asxl1+/+ and 5 asxl1−/− mutants at 6 dpf and 14 dpf. Muscle (A,D) and intestine (B,E) development had no difference between asxl1+/+ and asxl1−/− embryos at 6 dpf. Liver parenchyma at 6 dpf appeared abnormal with vacuolated cells in asxl1−/− embryos (F) compared with asxl1+/+ embryos (C). At 14 dpf, muscular atrophy was shown in asxl1−/− embryos (J) compared with normal striated muscle in asxl1+/+ embryos (G). Intestine in asxl1−/− embryos was abnormal with villus blunting (K) compared with normal nuclei and microvilli in the asxl1+/+ embryos (H). The asxl1−/− embryos exhibited progressive liver architectural distortion (L) compared to asxl1+/+ embryos (I).

Loss of asxl1 induces apoptosis in cmyb-expressing embryonic HSPCs. WISH for cmyb was performed at 36 hpf (A) and 3 dpf (B-E) in asxl1+/+, asxl1+/ and asxl1−/− zebrafish embryos. Boxes in panel B are shown at higher magnification in C-E. (F-H) HSPCs (GFP; green) and cells undergoing apoptosis (TUNEL, TMR red, Roche) in the CHT of 48-hpf asxl1+/+, asxl1+/ and asxl1−/− zebrafish embryos in the Tg(cmyb:EGFP) reporter line background were identified by immunofluorescence microscopy following a dual TUNEL/anti-GFP assay. Arrows indicate apoptotic HSPCs with combined EGFP and DMR red fluorescence signals. (I) cmyb:GFP+/TUNEL+ cells in asxl1+/+, asxl1+/− and asxl1−/− were quantified as a percentage of total cmyb:GFP+ cells. Bars represent the mean and s.e.m. for 8-9 embryos each. Unpaired Student’s t-tests and Prism software were used to determine the P-value for each genotypic group compared with control cells.

Complete loss of asxl1 leads to AML in zebrafish. WISH for cmyb was performed at 3 dpf in asxl1+/+ (A), asxl1+/ (B) and asxl1−/− (C) zebrafish embryos obtained from a cross of two asxl1+/ fish. (D) WISH for cmyb was performed at 3 dpf in asxl1−/− zebrafish embryos obtained from a cross of two asxl1−/− fish. Insets show a higher magnification of the CHT in each panel. (E) MGG staining was performed on kidney marrow smears and peripheral blood smears of asxl1+/+ and asxl1−/− fish at 17 months of age. Normal maturation and morphology are shown across a spread of blood cells in the kidney marrow of the asxl1+/+ zebrafish. In the asxl1−/− fish, the kidney marrow is replaced with immature myeloid blast cells in a pattern resembling AML. Circulating immature myeloid blast cells were observed in the peripheral blood of the asxl1−/− zebrafish, but not asxl1+/+ fish. Erythrocytes, black arrow; myeloid cells, green arrow; blast cells, blue arrow; lymphocytes, red arrow.

Overexpression of bim and bid mediates apoptosis in asxl1−/−HSPCs. (A,B) Quantitative PCR was performed with cDNA isolated from the trunks of 48 hpf asxl1+/+, asxl1+/ and asxl1−/− zebrafish embryos to quantify the expression of pro-apoptotic (A) and anti-apoptotic (B) members of the Bcl2 family. Expression levels are shown relative to β-actin. The values are means of triplicate runs with s.e.m. Statistical significance was determined with unpaired Student's t-test. Results from a single experiment are shown; however, four independent experiments were performed for both panels A and B with similar results. (C) WISH to detect cmyb with the indicated genotypes at 3 dpf, showing that the loss of HSPCs in asxl1−/− fish is rescued by loss of bim. (D) Cropped CHT regions from panel C were quantified with use of 98 embryos per genotype with ImageJ software. (E) WISH to detect cmyb was performed at 3 dpf for embryos with the indicated genotypes that were injected with 16 ng of either bid morpholino or control morpholino, showing that the loss of HSPCs in asxl1−/− fish is rescued by loss of bid. (F) Cropped CHT regions from panel E were quantified with use of 60 embryos per genotype and ImageJ software. (G) WISH to detect cmyb was performed at 3 dpf for embryos with the indicated genotypes that were injected with 100 ng/µl mRNA encoding either Bcl2 or GFP. Overexpression of bcl2 rescued the loss of HSPCs in asxl1−/− fish. (H) Cropped CHT regions from panel G were quantified with use of 70 embryos per genotype and ImageJ software. In panels D, F and H, black bars representing the median values. Statistical analysis was done with Prism software. Unpaired Student's t-tests were performed in Prism software to determine the P-value for each genotype group compared to controls.

Combined loss of asxl1 and tet2 leads to MPN and AML in a subset of adult zebrafish. Morphological and quantitative analysis of blood cell types in the kidney marrow and peripheral blood of 5-month-old fish with the indicated genotypes. MGG staining was performed on kidney marrow smears. (A-H) Red arrows denote mature erythrocytes; light blue arrows denote myelomonocytes; green arrows denote lymphocytes; black arrows denote progenitor cells; and orange arrows denote immature red blood cells. (A) In wild-type fish, the kidney marrow hematopoietic cells showed normal maturation and morphology. (B) Five of 11 asxl1+/tet2+/+ fish had an increased number of mature myeloid cells, indicating MPN; the remaining 6 fish had normal morphology. (C) Eight of 11 asxl1+/tet2+/ fish showed an increased number of mature myeloid cells, indicating MPN. (D) Two of 10 asxl1+/tet2−/− fish showed increased myeloid blast cells, indicating AML. Four of the remaining 8 fish had MPN, while the other 4 had normal morphology. (E-H) Analysis of peripheral blood smears by MGG staining. (E) Wild-type fish had normal maturation and morphology of the blood cells. (F) Five of 11 asxl1+/tet2+/+ fish showed rounded circulating immature red blood cells and increased mature myeloid cells. (G) Eight of 11 asxl1+/tet2+/ fish showed immature rounded circulating red blood cells. (H) Two of 10 asxl1+/tet2−/− fish showed an increased number of myeloid blast cells, myelomonocytes and immature erythrocytes. (I-L) Forward- versus side-scatter analysis of kidney marrow cell populations in 5-month-old fish with the indicated genotypes. (M-P) Forward- versus side-scatter analysis of absolute cell numbers per liter of blood in 5-month-old fish with the indicated genotypes, showing increased myelomonocytes and decreased red blood cells in asxl1+/ fish. A subpopulation of asxl1+/tet2−/− fish showed increased progenitor cell numbers in kidney marrow and blood. Mean values with s.e.m. are shown. Statistical analysis was done with Prism software. Unpaired Student's t-tests were performed in Prism to determine the P-value for each genotypic group compared with controls.

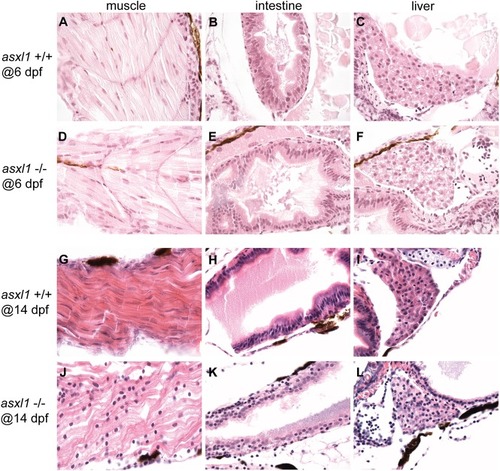
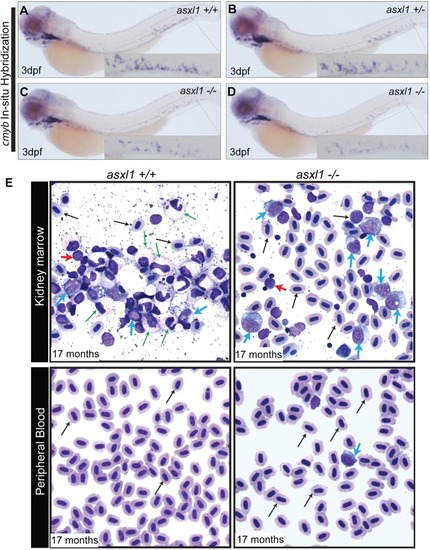
Histopathological analysis of kidney, intestine and liver development in 17-month-old asxl1+/+ and asxl1+/- and asxl1-/- fish. Results revealed that intestine (D, E and F) and liver (G, H and I) was normal and similar to that of the fish, indicating that these fish recovered from early developmental hypoplasia in these organs. However, asxl1-/- mutants did have decreased numbers of erythroid islands in the kidney marrow compared with asxl1+/+ and asxl1+/- fish (A, B and C), indicating that the hematopoietic system is abnormal in these animals. Area encircled with black line indicates erythroid islands. The quantification of erythroid islands was shown in (J), with the black bars representing the median values. ns p>0.05, *p<0.05, **p<0.01 by two-tailed unpaired t-test.

Whole-mount in situ hybridization (WISH) for gata-1 (22 hours-post-fertilization), l-plastin and mpx (22 hours-post-fertilization) was performed in asxl1+/+, asxl1+/-, asxl1-/-, asxl1+/+tet2 -/-, asxl1+/-tet2 -/- and asxl1-/-tet2 -/- zebrafish embryos. This assay shows that there is no difference in the number of cells expressing gata-1, l-plastin and mpx among all the different genotypes.


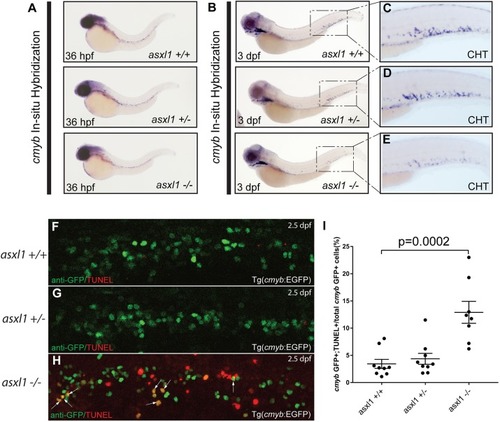
The number of HSPCs in the CHT is reduced in the asxl1 -/- embryos at 3 dpf. (A-C) EGFP+ HSPCs in asxl1 +/-, asxl1 +/- and asxl1 -/- embryos. (D) Statistical analysis of HSPC numbers in asxl1 +/-, asxl1 +/- and asxl1 -/- embryos indicate that EGFP+ HSPCs are decreased in CHT region in asxl1 -/- embryos at 3 dpf


EGFP+ HSPCs in asxl1 +/+, asxl1 +/- and asxl1 -/- embryos at 3 dpf. Knockdown of bim (D-F) and bid (G-I) or overexpression of bcl2 (J-L) each were able to partially rescue HSPC numbers in asxl1 -/- embryos compared with control embryos. This result is expected because mitochondrial intrinsic programmed cell death depends on the combined activities of BH3-only pro-apoptotic proteins and is blocked by prosurvival proteins like bcl2.


Acknowledgments
This image is the copyrighted work of the attributed author or publisher, and ZFIN has permission only to display this image to its users. Additional permissions should be obtained from the applicable author or publisher of the image. Full text @ Dis. Model. Mech.