
- Title
-
A 3D Atlas of Hematopoietic Stem and Progenitor Cell Expansion by Multi-dimensional RNA-Seq Analysis
- Authors
- Xue, Y., Liu, D., Cui, G., Ding, Y., Ai, D., Gao, S., Zhang, Y., Suo, S., Wang, X., Lv, P., Zhou, C., Li, Y., Chen, X., Peng, G., Jing, N., Han, J.J., Liu, F.
- Source
- Full text @ Cell Rep.
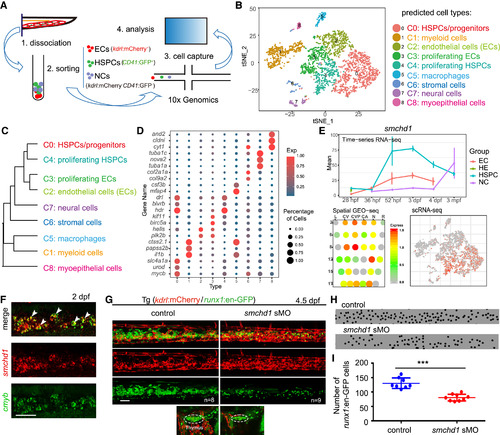
A Single-Cell Resolution Map of Zebrafish CHT (A) The illustration of CHT single-cell RNA-seq (scRNA-seq) at 55 hpf. (B) t-Distributed Stochastic Neighbor Embedding (t-SNE) clustering map of 3,776 single cells from zebrafish CHT. (C) The hierarchy structure of 9 cell clusters. Single cells of the same group were combined together for hierarchical clustering. (D) Dot plot showing representative marker genes of the defined cell groups. Color indicates the ratio between the expression level of each group and the maximum expression level of all groups. Size of the dot is proportional to the percentage of cells expressing this gene (>1) in each group. (E) The expression pattern of smchd1 generated from bulk RNA-seq, GEO-seq, and scRNA-seq, respectively. (F) Double fluorescence in situ hybridization (FISH) analysis showing co-expression of smchd1 and cmyb in the CHT region at 3 dpf. White arrowheadsmark the smchd1+cmyb+ double positive cells. Scale bar, 50 μm. (G) Confocal imaging of the transgenic line (kdrl:mCherry/runx1:en-GFP) showing the number of GFP cells (runx1+) in the CHT and thymus regions in control and smchd1 morphants at 4.5 dpf. Dashed line circles mark the thymus region. ncontrol = 8; nsmchd1 sMO = 9. Scale bar, 50 μm. (H) The black spots mimicked the runx1+ cells in CHT region in (G). (I) The quantification data of runx1+ cells in CHT in control and smchd1morphants, showing as means ± SEM. ∗∗∗p < 0.001. The HSPCs were counted in about 6-somite regions of CHT in control embryos and morphants. |
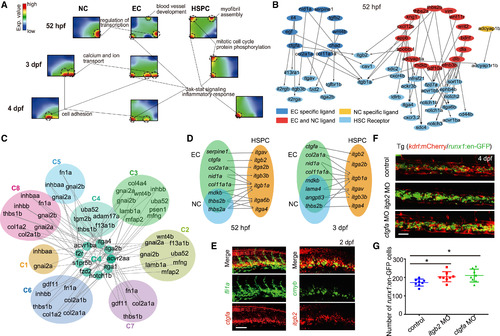
The Crosstalk between CHT Niche and HSPCs (A) SOM showing the distinct gene regulatory structure among NCs, ECs, and HSPCs at 52 hpf and 3 and 4 dpf. (B) Secretomics analysis showing the ligand-receptor regulatory relationship between HSPCs and CHT niche at 52 hpf. (C) The secretomics analysis for scRNA-seq data revealing the interaction pairs in distinct cell types, receptor-expressing C4 (proliferating HSPC) and ligand-expressing clusters. (D) The distribution of ligands and receptors in ECs (kdrl+ cells), HSPCs (CD41+cells), and NCs (kdrl-CD41- cells) at 52 hpf and 3 dpf based on bulk RNA-seqanalysis. (E) Double FISH showing the co-expression of ctgfa with fli1a, and itgb2 with cmyb at 2 dpf. Scale bar, 50 μm. (F) The confocal imaging of the transgenic line (kdrl:mCherry/runx1:en-GFP) showing the number of runx1+ cells in control, ctgfa morphants, and itgb2morphants at 4 dpf. Scale bar, 50 μm. (G) The quantification of confocal imaging displayed in (F) are shown as means ± SEM. ∗p < 0.05, n = 8. The HSPCs were counted in about the eight-somite region of the CHT in control embryos and morphants.
|
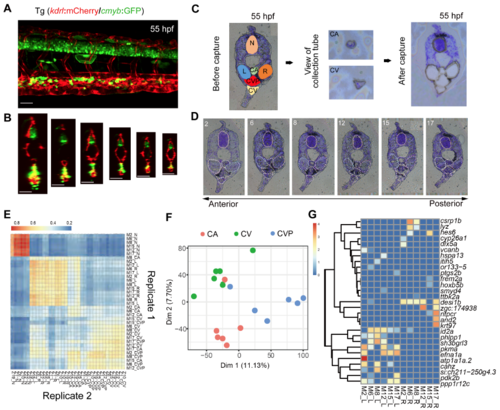
The overview and validation of GEO-seq A. The confocal imaging of 55 hpf CHT region of the transgenic line (kdrl:mCherry/cmyb:GFP) embryo. B. The transversal views of the zebrafish CHT region are displayed by Imaris software. C. The imaging showing the GEO-seq process including the locations of distinct samples on one section, and the achievement of sample collection after Lazer Capture Microdissection (LCM). D. The six sections of 55 hpf CHT from anterior region to posterior region covering about 400 um. E. Heatmap showing a high correlation between corresponding regions of two GEO-seq replicates. F. PCA of samples from caudal artery (CA), caudal vein (CV) and caudal vain plexus (CVP). G. DEGs identified between left muscle (L) and right muscle (R) samples showing no signifigant difference of gene expression between left muscle and right muscle regions. |

The GEO-seq analysis, related to figure 2. A. BICKmwans clustering of DEGs revealing seven typical expression pattern of all GEO-seq samples. B. The consistancy validation between whole mount in situ hybridization (WISH) data at 2 dpf and corn plots constructed from GEO-seq data for cc125b, irf4a, cmyb, and scl. C. Heatmap showing the region-specific expression of signaling pathway related genes in GEO-seq samples. D. The Connection Specificity Index (CSI) network displays the secretomics regulation among all GEO-seq samples by in silico secretomics analysis. |
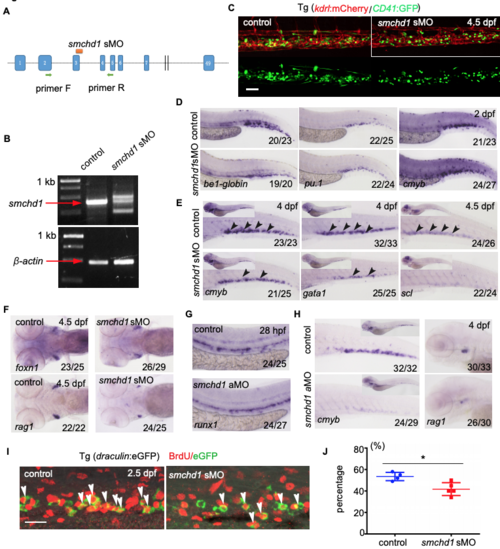
The hematopoietic deficiency in smchd1 morphants, related to figure 3. A The illustration of smchd1 splice morpholino (sMO) target site which is located between exon 3 and intron 3. B. The smchd1 sMO validation by RT-PCR. The agarose gel imaging showing the abnormal spliced transcripts in sMO injected embryos compared with control, B-actin used as control. C. Confocal imaging of the transgenic line (kdrl;mCherry/CD41:GFP) showing the number of CD41 cells in control and smchd1 sMO injected embryos at 4.5 dpf. n=4 D. WISH showing the expression of bel-globin, pu. 1 and cmyb at 2 dpf in control and smchd1 sMO injected embryos. E. WISH showing the expression of cmyb, gatal and scl at 4dpf in control and smchd1 sMO injected embryos. F. WISH showing the expression of rag1 and foxn1 at 4.5 dpf in control and smchd1 sMO injected embryos. G. WISH showing the expression of runx1 at 28 hpf in control and smchd1 ATG morpholino (aMO) injected embryos. H. WISH showing the expression of cmyb and rag1 in control and smchd1 aMO injected embryos at 4 dpf. I. The double staining image of anti-BrdU antibody and eGFP FISH in control and smchd1 morphants at 2.5 dpf. White arrowheads indicate draculin+BrdU+ double positive cells. J. The statistical data show the percentage of draculin+BrdU+/draculin+ cells in (I). n(control)=4, n(smchd1)=5. Data are shown as means +- SEM. *P<0.05 |

The specific role of integrin pathway for HSPC expansion, related to figure 5. A. The Venn diagram showing the overlapped receptors from the comprehensive analysis of three sequencing methods. B. The Venn diagram showing the overlapped ligands from the comprehensive analysis of three sequencing methods. C. WISH showing the expression of ctgfa and itgb2 at 2 dpf, 3 dpf and 4 dpf in zebrafish CHT region. D. The validation of ctgfa and itgb2 morpholino efficiency by fusion GFP plasmid injection. E. WISH showing the expression of runx1 in control embryos, itgb2 morphants and ctgfa morphants at 30 hpf. F. Confocal imaging of the transgenic line (CD41:GFP/gata1;dsRed) showing hematopoietic cells in the CHT region in control embryos, itgb2 morphants and ctgfa morphants at 3.5 dpf. G. The quantification data of CD41:GFP cells number in (F). Data are shown as means +- SEM. n=4, ns (no signifigant) P>0.05, *P<0,05. H. WISH the expression of showing cmyb, gatal, coro1a and mfap4 in control embryos, ctgfa morphants and itgb2 morphants at 4.5 dpf. I. qPCR results showing the expression of cmyb, pu. 1 and gatal in control embryos, ctgfa morphants and itgb2 morphants at 4 dpf. Data are shown as means +- SEM. n=3, **P<0.01, ***P<0.001. J. WISH data showing the expression of ctgfa in GFP+ and GFP- embryos at 3.5 dpf after heat shocking transgenic (hsp701:ccn2a-2A-EGFP) embryos. K. WISH results displaying the expression of cmyb at 4dpf in control embryos, ctgfa morphants, ctgfa MO injected hsp701:ccn2a-2A-EGFP+ embryos. L. The identification of itgb2 mutants by sequancing analysis of genomic DNA with seven base pairs deletion. M. The illustration showing the normal protein structure in wild-type embryos and the truncated protein structure in itgb2 mutants. N. WISH data showing the expression of cmyb in sibling and itgb2 mutants 4dpf. |