FIGURE SUMMARY
Title

Anteroposterior patterning of the zebrafish ear through Fgf- and Hh-dependent regulation of hmx3a expression

Authors
Hartwell, R.D., England, S.J., Monk, N.A.M., van Hateren, N.J., Baxendale, S., Marzo, M., Lewis, K.E., Whitfield, T.T.
Source
Full text @ PLoS Genet.

Duplicate double-anterior ear phenotypes resulting from early Fgf mis-expression or Hh pathway inhibition.

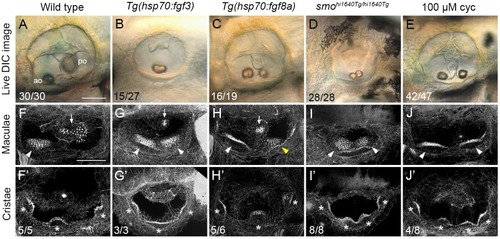
(A–E) Differential interference contrast (DIC) images of ears in live embryos at 3 dpf (72 hpf). (F–J’) Confocal images of FITC-phalloidin stains, revealing stereociliary bundles on sensory hair cells in the maculae (F–J) or cristae (F’–J’). Anterior maculae and duplicate anterior maculae are marked with arrowheads; posterior maculae and remnants of posterior maculae are marked with arrows. Cristae and duplicate cristae are marked with asterisks. Yellow arrowhead in H indicates macula that is ventromedial in position, and close to remnants of the posterior macula (arrow). Note the enlarged lateral crista in G’. (The bright spot in the centre of F’ is a lateral line neuromast.) Representative phenotypes are shown; numbers of embryos displaying these phenotypes are indicated on the panels. All Tg(hsp70:fgf3) heat-shocked embryos (n = 27) and smohi1640Tg/hi1640Tg mutants (n = 28) showed double-anterior ears. In B, 15/27 ears had a single fused otolith as shown; the remaining 12/27 ears had two separate, but small and ventrally-positioned otoliths. In C, 16/19 ears showed varying degrees of duplication with two small, ventrolaterally positioned otoliths (14/19, as shown) or fused otoliths (2/19). The remaining 3/19 ears showed a wild-type phenotype. In D, 17/28 ears had two otoliths touching as shown; in the remaining 11/28 ears, the otoliths were separate, but both small and ventrally positioned. Genotypes or treatments are indicated for each column. Transgenic lines were subject to 30 minutes of heat shock at 14 hpf. Additional controls for this figure are shown in S1 Fig. Lateral views; anterior to the left. Abbreviations: ao, anterior (utricular) otolith; po, posterior (saccular) otolith; cyc, cyclopamine. Scale bar in A, 50 μm (applies to A–E); scale bar in F, 50 μm (applies to F–J’).

Expression of the otic anterior marker genes <italic>hmx3a</italic>, <italic>hmx2</italic> and <italic>pax5</italic> after early <italic>fgf3</italic> mis-expression.

In situ hybridisation of otic expression patterns in Tg(hsp70:fgf3) embryos following a 30-minute heat shock (HS) at the 10-somite stage (14 hpf). Controls (left-hand panels of each pair of images) were sibling non-transgenic embryos subjected to the same heat shock. Numbers in the dorsal view panels indicate the number of embryos with the phenotype shown and total number (e.g. 13/25) from a mixed batch of transgenic and non-transgenic embryos in each pair of panels; 50% of the batch was expected to be transgenic. (A–F) Two hours after heat shock (16 hpf), expression of hmx3a expanded to cover the entire otic region (B), but there was only a trace of expression of hmx2 or pax5 in the otic placode at this stage. Weak expression of pax5 in the hindbrain after heat shock (F) did not persist (L). (G–L) At 22.5 hpf (8.5 hours after HS), expression of all three genes had now expanded to cover the entire anteroposterior axis of the otic vesicle on the medial side. (M–R’) At 36 hpf (22 hours after HS), expression of hmx3a remained expanded across the otic anteroposterior axis (N,N’); expression of hmx2 was strong at the anterior and posterior poles, and weaker in central regions (P,P’), whereas expression of pax5 resolved into two discrete domains at the anterior and posterior poles of the otic vesicle, and was lost from central regions (R,R’). White arrowheads indicate regions that are normally free of expression in controls; black arrowheads mark ectopic expression in transgenic embryos. A–R are dorsal views showing both otic vesicles, with anterior to the top; M’–R’ are lateral views with anterior to the left. Scale bars, 50 μm (scale bar in A applies to A–L; in M applies to M–R; in M’ applies to M’–R’). For additional examples and time points for hmx2, see S4 Fig; for pax5, see S5 Fig.

Expression of the otic anterior marker genes <italic>hmx3a</italic>, <italic>hmx2</italic> and <italic>pax5</italic> after Hh pathway inhibition.

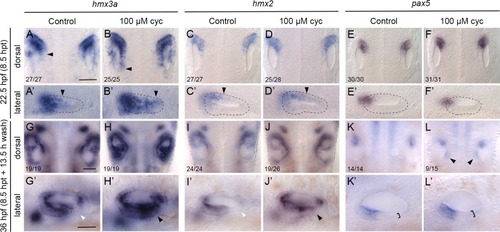
Expression of mRNA for anterior otic markers in embryos treated with 100 μM cyclopamine (cyc) from the 10-somite stage (14 hpf) until 22.5 hpf. Controls in the left-hand panels of each pair of images were treated with vehicle (ethanol) only. (A–F’) At 22.5 hpf (8.5 hours post initiation of treatment, hpt), expression of hmx3a expanded into posterior regions of the otic vesicle (arrowheads); expression of hmx2 showed a modest expansion and there was no change in the otic expression pattern of pax5. Arrowheads in A–D’ indicate posterior extent of otic expression. (G–L’) At 36 hpf (8.5 hpt + 13.5 h wash), expression of both hmx3a and hmx2 extended into posteroventral regions of the otic epithelium. White arrowheads indicate regions that are normally free of expression in controls; black arrowheads mark ectopic expression in cyclopamine-treated embryos. By 36 hpf, expression of pax5 appeared in a new discrete domain in posteromedial otic epithelium after cyclopamine treatment (L, arrowheads); in a lateral view, the epithelium in posterolateral regions was thicker than normal (K’,L’, brackets). A–L are dorsal views showing both otic vesicles, with anterior to the top; A’–L’ are lateral views with anterior to the left. Scale bars, 50 μm (scale bar in A applies to A–F’; in G applies to G–L; in G’ applies to G’–L’).

Otic expression of <italic>fgf</italic> genes following mis-expression of <italic>fgf3</italic> or inhibition of Hh signalling.

(A–F’) In situ hybridisation for otic expression of fgf genes in Tg(hsp70:fgf3) embryos following a 30-minute heat shock (HS) at the 10-somite stage (14 hpf). Controls (left-hand panels of each pair of images) were sibling non-transgenic (Non-Tg) embryos subjected to the same heat shock. Numbers of embryos shown in the dorsal view panels indicate the number showing the phenotype from a mixed batch of transgenic and non-transgenic embryos in each pair of panels; 75% of the batch is expected to be transgenic. A–B’ show staining with a probe specific to the 3’ UTR of fgf3: note the ectopic patch of endogenous fgf3 expression at the posterior otic pole (B,B’; arrowheads) and disruption to fgf3 expression ventral to the otic vesicle (B’; asterisks) after heat shock in transgenic embryos. Expression of fgf10a is strengthened in the otic vesicle of transgenic embryos after heat shock (E–F’). (G–Q’) Expression of mRNA for fgf genes in embryos treated with 100 μM cyclopamine (cyc) from the 10-somite stage (14 hpf) until 22.5 hpf. Controls in the left-hand panels of each pair of images were treated with vehicle (ethanol) only. Numbers of embryos with the phenotype shown for individual treatments are indicated in the dorsal view panels. There was little change to the otic expression patterns of fgf3 or fgf8a at 22.5 hpf (8.5 hours post treatment) (G–J’), but note the loss of fgf3 expression ventral to the ear (H’; asterisk). Expression of fgf10a in the otic vesicle was strengthened after inhibition of Hh signalling in about 50% of treated embryos (L,L’). At 36 hpf (8.5 hpt + 13.5 h wash), ectopic expression of both fgf3 and fgf8a appeared in a new posteromedial domain in the ears of cyclopamine-treated embryos (M-P’; arrowheads). (Q,Q’) Expression of fgf8a in the posterior of the otic vesicle at 48 hpf (8.5 hpt + 25.5 h wash). Ectopic expression has strengthened (arrowhead) and medial epithelium is thinner than normal (brackets). Dorsal views of the left ear, with anterior to the top. Scale bar in A, 50 μm (applies to A–L); scale bar in A’, 50 μm (applies to A’–L’); scale bar in M, 50 μm (applies to M–P); scale bar in M’, 50 μm (applies to M’–P’); scale bar in Q, 20 μm (applies to Q,Q’).

Fused otoliths and sensory maculae, and reduction of anterior otic character, in <italic>hmx3a</italic><sup><italic>SU3/SU3</italic></sup> mutants.

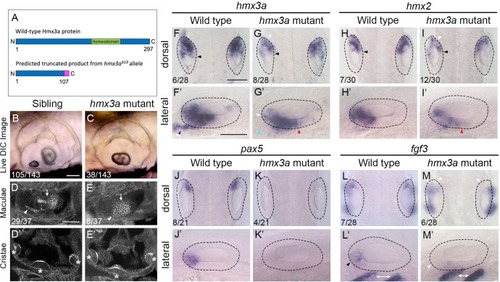
(A) Schematic diagram showing the predicted truncated product for the hmx3aSU3 allele. The mutation was generated using a CRISPR sgRNA targeting sequence in exon 2 upstream of the DNA-binding homeodomain (green). The predicted truncated protein produced by the hmx3aSU3/SU3 allele contains a Thr to Gly substitution at amino acid 107, followed by a stretch of 10 further incorrect amino acids (magenta). The truncated protein lacks the homeodomain. (B,C) Differential interference contrast (DIC) images of ears in live embryos at 3 dpf (72 hpf). Numbers of embryos in a batch from a mating between heterozygous parents are given. Note the fused otolith in the hmx3aSU3/SU3 mutant ear (C). (D–E’) FITC-phalloidin stains of the sensory maculae (D,E) and cristae (D’,E’) in the ear at 3 dpf (72 hpf). Numbers of embryos showing the phenotype from a cross between heterozygous parents are shown. White arrowhead: anterior macula; white arrow: posterior macula; asterisks indicate cristae. Additional examples are shown in S9 Fig. (F–M’) In situ hybridisation for otic anterior markers at 24 hpf in genotyped wild-type and hmx3aSU3/SU3 mutant embryos. The dotted outline marks the outer edge of the otic epithelium. Black arrowheads in F–I indicate the extent of hmx expression in medial epithelium; white arrowheads indicate areas of reduced expression levels; blue arrowhead in F’ marks presumed otic or anterior lateral line neuroblasts; light blue arrowhead in G’ indicates loss of expression in this area; red arrowheads in G’,I’ mark expansion of expression in ventral otic epithelium. Black arrowhead in L’ indicates anterior otic expression domain of fgf3, lost in M,M’ (white arrowheads); white double-headed arrows mark expression of fgf3 in pharyngeal pouch endoderm. Numbers in panels F–M indicate numbers of embryos genotyped as either wild type or homozygous mutant that showed the representative expression patterns illustrated. Scale bars, 50 μm (scale bar in B applies to B,C; scale bar in D applies to D–E’; scale bar in F applies to F–I, J–M; scale bar in F’ applies to F’–I’, J’–M’).

Mis-expression of <italic>hmx3a</italic> is not sufficient to generate an anterior ear duplication.

(A–D) Control experiments to check for successful expression of the hmx3a transgene after heat shock at 12 hpf. Embryos were fixed and stained by in situ hybridisation two hours later, at 14 hpf. (A,B) A mixed batch of embryos from a cross between a fish hemizygous for the transgene and a wild type (WT). All embryos (31/31) showed the normal pattern of expression of hmx3a in the absence of heat shock (A). After a 60-minute heat shock at 12 hpf, ~50% of the batch (17/30) showed strong, systemic expression of the transgene at 14 hpf, as expected (B). All embryos shown in B were stained in the same tube. (C,D) Embryos heat-shocked for 60 minutes at 12 hpf were sorted on the basis of tdTomato expression before fixing. All tdTomato-negative embryos (14/14) were also negative for expression of the hmx3a transgene (C); all tdTomato-positive embryos (16/16) were also positive for hmx3a transgene expression (D). (E,F) Live DIC images of ears of non-transgenic (E) and transgenic (F) sibling embryos at 3 dpf (72 hpf), after a 30-minute heat shock at 14 hpf. (G–H’) Confocal images of FITC-phalloidin-stained ears at 3 dpf (72 hpf). Position and size of the two maculae (G,H, arrowheads and arrows) and three cristae (G’,H’, asterisks) were normal in both non-transgenic and transgenic sibling embryos after heat shock. (I–Q’) In situ hybridisation for otic marker genes in non-transgenic and Tg(hsp70:hmx3a) sibling embryos after a 30-minute heat shock at 14 hpf. Dorsal views of both otic vesicles (I–Q) and lateral views of a single otic vesicle (I’–Q’) are shown. Note weak ectopic expression of hmx2 and pax5, and posterior otic expression of fgf3, in the otic vesicles of a minority of transgenic embryos (right hand column; arrowheads). Numbers of embryos showing the phenotypes are shown for each panel. WT, wild type (AB strain). Scale bar in E, 50 μm (applies to E–F); scale bar in G, 50 μm (applies to G–H’); scale bar in I, 50 μm (applies to I–Q); scale bar in I’, 50 μm (applies to I’–Q’).

Acknowledgments
This image is the copyrighted work of the attributed author or publisher, and ZFIN has permission only to display this image to its users. Additional permissions should be obtained from the applicable author or publisher of the image. Full text @ PLoS Genet.