
- Title
-
Soybean Meal-Induced Intestinal Inflammation in Zebrafish Is T Cell-Dependent and Has a Th17 Cytokine Profile
- Authors
- Coronado, M., Solis, C.J., Hernandez, P.P., Feijóo, C.G.
- Source
- Full text @ Front Immunol

ZFIN is incorporating published figure images and captions as part of an ongoing project. Figures from some publications have not yet been curated, or are not available for display because of copyright restrictions. PHENOTYPE:
|
|
ZFIN is incorporating published figure images and captions as part of an ongoing project. Figures from some publications have not yet been curated, or are not available for display because of copyright restrictions. EXPRESSION / LABELING:
PHENOTYPE:
|
|
ZFIN is incorporating published figure images and captions as part of an ongoing project. Figures from some publications have not yet been curated, or are not available for display because of copyright restrictions. |

Neutrophils, macrophages, and mast cells increase their presence in the gut during the inflammatory process triggered in the naïve feeding model. The number of neutrophils/macrophages (A), and mast cells (B) was quantified under different conditions (n, naïve; CTRL, control; INFL, inflammation) and time points (T0: 5 dpf; T4: 9 dpf). (C) Relative mRNA levels of gzma, nkla, and nkld were analyzed. Data were normalized against rpl13aand compared to T4 naïve condition (dotted line). (D)Scheme of a lateral view of a 9 dpf larva with the zone of the intestine used to quantify delimited by the red rectangle. (E–H) Lateral view of the intestine of a Tg(lysC:DsRed)xTg(mpeg1:Dendra2) larva showing fluorescently labeled neutrophils (red) and macrophages (green). (M–P) Lateral view of the intestine showing mast cells labeled by anti-tryptase immunohistochemistry. Zoom of macrophages and neutrophils (I–L) and mast cells (Q–T). *p < 0.05; ***p < 0.001; ****p < 0.0001. Scale bar 200μm. Experiments were done at least in three biological replicates with 20 individuals per condition. |
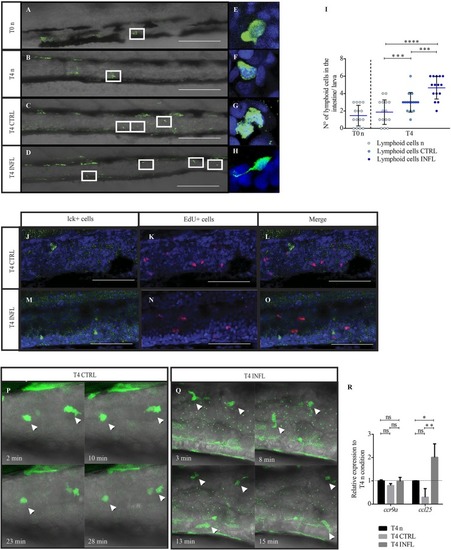
Lymphoid cells are present in the intestine as early as 5 dpf and are able to respond to food antigens. (A–D) Lateral view of the intestine from a Tg(lck:lck-eGFP) larva showing fluorescently labelled lymphoid cells (green). (E–H) Higher magnification of lymphocytes under the different conditions. (I) Quantification of lymphoid cells under the different conditions (n: naive; CTRL: control; INFL: inflammation) and time points (T0: 5 dpf; T4: 9 dpf). (J–O) T cells in control (J) or inflamed (M) intestine do not colocalize with EdU+ cells (K,L,N,O). (P) Example of migration of T cells (arrowhead) in a Tg(lck:lck-eGFP) larvae fed with control diet (derived from Supplementary Movie 1). (Q) Example of the migration of T cells (arrowheads) in a Tg(lck:lck-eGFP) larva fed with inflammatory diet (derived from Supplementary Movie 2). (R) Relative mRNA levels of ccl25 and ccr9a were analyzed in the intestine of control and inflamed larvae. Data was normalized against rpl13a and compared to naïve or maintenance condition (dotted line). *p < 0.05; **p < 0.01; ***p < 0.001; ****p > 0.0001. Scale bar for A–D 200 μm and J–O 100 μm. Experiments were done at least in three biological replicates with 20 individuals per condition. |