
- Title
-
NIPSNAP1 and NIPSNAP2 Act as "Eat Me" Signals for Mitophagy
- Authors
- Princely Abudu, Y., Pankiv, S., Mathai, B.J., Håkon Lystad, A., Bindesbøll, C., Brenne, H.B., Yoke Wui Ng, M., Thiede, B., Yamamoto, A., Mutugi Nthiga, T., Lamark, T., Esguerra, C.V., Johansen, T., Simonsen, A.
- Source
- Full text @ Dev. Cell
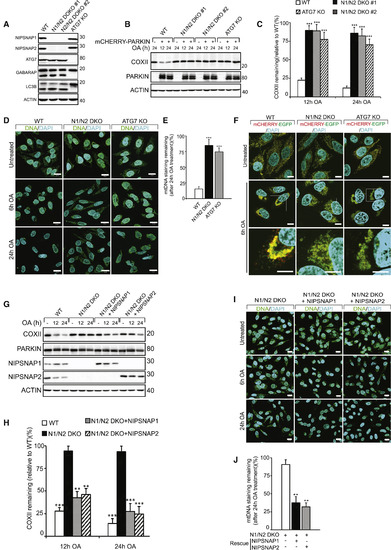
NIPSNAP1 and NIPSNAP2 Are Required for Mitophagy (A) CRISPR-Cas9-mediated double knockout of NIPSNAP1 and NIPSNAP2 (N1/N2 DKO) or ATG7 in HeLa cells were confirmed by immunoblotting. The effect of ATG7 KO on autophagy was confirmed by immunoblotting against LC3B and GABARAP. (B) WT, N1/N2 DKO, and ATG7 KO HeLa cells with or without mCherry-PARKIN expression were treated with OA for 12 or 24 h and extracts immunoblotted as indicated. (C) Densitometry of COXII protein levels relative to WT in (B). Values are mean ± SD ∗∗∗p < 0.001, one-way ANOVA. (D) Representative images of mCherry-Parkin expressing WT, N1/N2 DKO and ATG7 KO cells treated with OA for 6 or 24 h, immunostained for mtDNA nucleoids (green) and DAPI (blue). Scale bars are 20 μm. (E) Quantification of mtDNA nucleoid staining shown in (D) from three independent experiments. More than 100 cells were quantified per sample. Values are mean ± SD ∗∗∗p < 0.001, one-way ANOVA. (F) WT, N1/N2 DKO, and ATG7 KO HeLa cells stably expressing the mCherry-EGFP-OMP25TM mitophagy reporter were left untreated or treated with OA for 6 h and analyzed by confocal microscopy. Scale bars are 10 μm. (G) mCherry-PARKIN expressing WT, and N1/N2 DKO HeLa cells were rescued or not with untagged NIPSNAP1 or NIPSNAP2, followed by treatment with OA for 12 or 24 h and immunoblotting. (H) Quantification of COXII levels relative to WT from data shown in (F). Values are mean ± SD ∗∗∗p < 0.001, ∗∗p < 0.005, one-way ANOVA. (I) Representative images of mCherry-PARKIN expressing N1/N2 DKO cells rescued or not with NIPSNAP1 or NIPSNAP2 treated with OA for 6 or 24 h, then immunostained for mtDNA nucleoids (green) and DAPI (blue). Scale bars are 20 μm. (J) Quantification of mtDNA staining of data shown in (I). More than 100 cells were quantified per sample. Similar results were obtained in three independent experiments. Values are mean ± SD ∗∗p < 0.005, one-way ANOVA. |
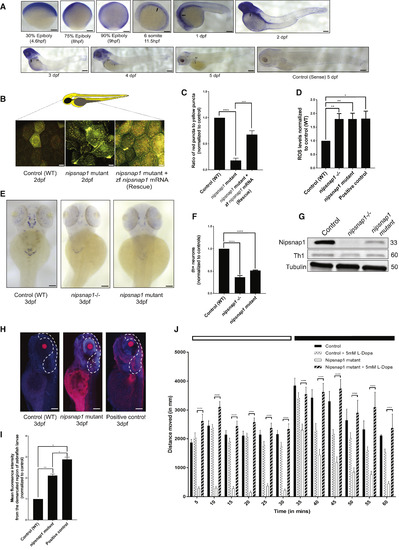
Nipsnap1-Deficient Zebrafish Larvae Display Parkinsonism (A) Spatial expression pattern of nipsnap1 across different development stages of zebrafish as demonstrated by whole-mount in situhybridizations. All embryos are in lateral view. Scale bar is 200 μm. (B) Representative images of control (WT), nipsnap1 mutant, and rescue (nipsnap1 mutant + zebrafish nipsnap1 mRNA) transgenic tandem-tagged mitofish larvae at 3 dpf. Images are from head region of zebrafish larvae. Scale bars are 20 μm. (C) Quantification of ratio of red puncta to yellow puncta (representative of mitophagy) per cell. Average of 15 cells from each of 25 larvae for control (WT), nipsnap1 mutant, and nipsnap1 mutant + rescue; tandem-tagged mitofish larvae from three independent experiments were used for quantification. (D) Control (WT), nipsnap1−/− and nipsnap1 mutant embryos at 3 dpf incubated with CellROX and ROS levels quantified from six different experiments. Error bars represent ± SEM. (E) Spatial expression pattern of tyrosine hydroxylase 1 (th1) gene in control (WT), nipsnap1−/− and nipsnap1 mutant embryos at 3 dpf determined by whole-mount in situ hybridization. Orientation dorsal. Scale bar is 200 μm. (F) Quantification of the number of Th1 positive neurons from images in (D). 10 control (WT), 20 mutant and 20 knockout larvae were used for quantification. Values were normalized to control (WT) values. (G) Representative immunoblots of Nipsnap1, Th1, and β-tubulin on whole embryo lysates of WT, nipsnap1−/− and nipsnap1 mutant embryos at 3 dpf. β-tubulin served as loading control. (H) Representative images of TUNEL assay on control (WT), nipsnap1mutant and DNase-treated WT larvae (positive control) at 3dpf. Orientation lateral. Scale bar is 200 μm. (I) Quantification of mean fluorescent intensity from demarcated region from images in (H). 10 control (WT), 15 nipsnap1 mutant, and 10 positive control larvae were used for quantification, respectively. Values were normalized to control (WT) values. (J) Motility analysis of WT and nipsnap1 mutant embryos at 7 dpf using the “Zebrabox” automated videotracker (Viewpoint, Lyon). Assay was carried out during daytime, one cycle of 20 min exposure to light (white horizontal bar) followed by 20 min of darkness (black horizontal bar). Vertical bars indicate average distance moved during 5 min intervals. Controls and nipsnap1 mutants were treated or not with 5 mM of L-DOPA for 1 h, after which they were analyzed for motility. Each group consisted of 20–24 larvae. All error bars indicate SEM. ∗p < 0.05, ∗∗p < 0.005, ∗∗∗p < 0.0005, ∗∗∗∗ p < 0.00005, unpaired Student’s t test EXPRESSION / LABELING:
PHENOTYPE:
|

Figure S7. Expression pattern and phylogenetic analysis of Nipsnap1 and Nipsnap2in Zebrafish,Related to Figure 7A-B.ClustalW alignment of Nipsnap1 (A) and Nipsnap2/Gbas (B) amino acid sequences from zebrafish (Danio rerio, accession NP_571108 and NP_571109, respectively) with the respective human and mouse sequences. Identical residues are boxed in black. The N-terminal 23 amino acids of zebrafish Nipsnap1 are predicted to act as a MLS (MitoProt II) (red line). The DABB1 domain (green boxed region)and the DABB2/Nipsnap domain (blue boxed region) are highly conserved with amino acid identities of ≥ 90%, indicating a similar function across species. C. Temporal expression pattern of nipsnap1 andnipsnap2. The graph shows the fold change in transcript relative to beta-actin in whole zebrafish embryos from 1 cell to 7 dpf. Error bars indicate mean ± SEM D. Spatial expression pattern of nipsnap2 across the different development stages of zebrafish as demonstrated by whole-mount in situ hybridization at the indicated stages. All embryos were in lateral view. Scale bar -200 μm. E. Immunblotting for Nipsnap1 and Nipsnap2 in lysates from different tissues of adult zebrafish. F. Manipulations of the zf nipsnap1gene. Schematic description of the exon (black boxes) and intron (black lines) structure of the nipsnap1 gene. Scissors indicate the sgRNA1 used to target the 1st exon to make the nipsnap1 KO embryos (nipsnap-/-). A chromatogram showing the genotype of then nipsnap1 sa14357 mutant allele (nipsnap1mutant) is shown. The change in allele from T to A has been highlighted. G. Representative immunoblotting images of Nipsnap1 and β-tubulin on whole embryo lysates of nipsnap1 mutant, rescue and WT embryos at 3dpf. β-tubulin serves as the loading control. H. Representative FACS plot showing oxidative stress in Controls (WT), nipsnap1-/- embryos and nipsnap1 mutant embryos at 3 dpf using the CellROX reagent. H2O2 was added to the water for 1 h as a positive control. I. Quantification of the Th1 signal intensities from blots in (Fig 7G) normalized to WT signal intensity. Error bars indicate mean ± SEM. *p < 0.05, **p < 0.005, ***p < 0.0005, **** p < 0.00005, unpaired Students t-test. J.Qualitative analysis of the plate used for zebrabox experiments with L-DOPA added. Top 6 wells contain WT larvae, bottom six wells contain nipsnap1 mutant larvae. Plate was used for swimming assay earlier and then kept overnight to see oxidation of L-Dopa by visualizing the change in color. |
Reprinted from Developmental Cell, 49(4), Princely Abudu, Y., Pankiv, S., Mathai, B.J., Håkon Lystad, A., Bindesbøll, C., Brenne, H.B., Yoke Wui Ng, M., Thiede, B., Yamamoto, A., Mutugi Nthiga, T., Lamark, T., Esguerra, C.V., Johansen, T., Simonsen, A., NIPSNAP1 and NIPSNAP2 Act as "Eat Me" Signals for Mitophagy, 509-525.e12, Copyright (2019) with permission from Elsevier. Full text @ Dev. Cell