
- Title
-
Ciliary genes arl13b, ahi1 and cc2d2a differentially modify expression of visual acuity phenotypes but do not enhance retinal degeneration due to mutation of cep290 in zebrafish
- Authors
- Lessieur, E.M., Song, P., Nivar, G.C., Piccillo, E.M., Fogerty, J., Rozic, R., Perkins, B.D.
- Source
- Full text @ PLoS One
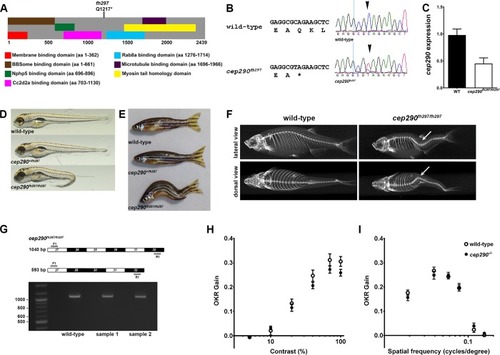
Genetic mapping and identification of cep290 mutant allele. (A) Schematic structure of zebrafish Cep290 illustrating the location of predicted protein domains. Domain structure is based on prior results [12, 44, 45]. The cep290fh297 allele generates a premature stop codon at amino acid 1217. (B) Chromatograms of Sanger sequencing reactions of cDNAs from wild-type and homozygous cep290fh297/fh297mutant confirming the C>T replacement. (C) Quantification of cep290 mRNA in 6 month old wild-type and mutant retinas by digital droplet PCR (ddPCR). (D) Lateral views of representative wild-type (top), heterozygous (middle), and homozygous (bottom) mutants at 5 dpf. At larval stage 30% of cep290fh297/fh297 mutant animals show ventral tail curvature. (E) Lateral view of 7 month old wild-type, heterozygous and a representative cep290fh297/fh297 mutants displaying distorted vertebral column. At adult stage 100% of the homozygous mutant animals show scoliosis of the vertebral column. (F) Representative micro-CT-generated images of lateral (top) and dorsal (bottom) views of adult wild-type and cep290fh297/fh297 mutants. Images demonstrate that spinal curvature deviates within the dorsal/ventral plane as well as curves laterally (arrows). (G, top) Forward (F1) and reverse (R1) PCR primers were designed to bind sequences in exons 27 and 32 in order to flank exon 29 harboring the mutant cep290fh297 allele. Exon skipping would result in a truncated PCR product of 593 bp, while retention of exon 29 would result in a full-length 1040 bp product. (G, bottom) Results of PCR reactions from cDNAs generated from wild-type and samples of two individual mutants resulted in full-length products of 1040 bp. 100 bp ladder shown in lane 1. (H) Optokinetic response (OKR) contrast response function of 5 dpf wild-type larvae (n = 11; open circles) and cep290fh297/fh297 mutants (n = 26; closed circles). No significant differences were found. (I) OKR spatial frequency results for wild-type larvae (n = 13) and cep290fh297/fh297mutants (n = 15). Error bars = s.e.m.
|
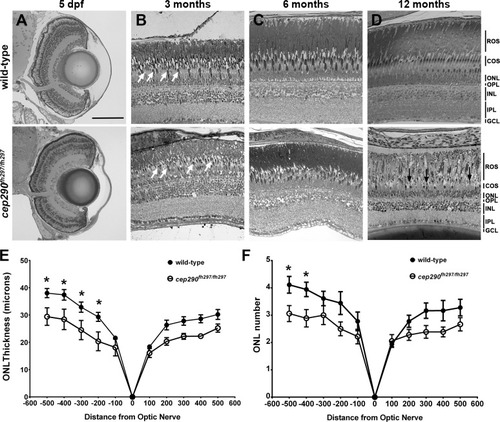
Progressive cone loss in adult cep290fh297/fh297 mutants. Methylene blue stained transverse histological sections of retinas from wild-type (top) and cep290fh297/fh297 mutants (bottom) at 5 dpf (A); 3 months of age (B), 6 months of age (C), and 12 months of age (D). At 3 months, the cep290fh297/fh297 mutants (bottom) had noticeably fewer cones (white arrows) and thinning of the cone outer segment (COS) layer. Few cones were observed at 12 months of age in cep290fh297/fh297mutants (black arrows). (E) Quantification of ONL thickness and (F) rows of nuclei in the ONL at different distances from the optic nerve in both the dorsal (negative numbers; left) and ventral (positive numbers; right) retina of cep290fh297/fh297 mutants and wild-type sibling controls at 8 months of age. Data are shown as means ± SEM (n = 6, *P ≤ 0.05). ROS, rod outer segments; COS, cone outer segments; ONL, outer nuclear layer; OPL, outer plexiform layer; INL, inner nuclear layer; IPL, inner plexiform layer; GCL, ganglion cell layer. Scale bar: 100 μm. |

Cone degeneration marked by outer segment disorganization in cep290fh297/fh297 mutants. (A-C) Transmission electron micrographs of retinal sections from 6 month old wild-type (A) and cep290fh297/fh297 mutant adults (B, C). Cone outer segments and mitochondria in the ellipsoids are visible in the wild-type retina. In the cep290fh297/fh297 mutant retinas, cone outer segments are missing or disorganized (arrows) and the outer nuclear layer (ONL, white line) is reduced to 1–2 nuclei. (D, E) At higher magnification, the outer segment disc membranes are tightly stacked in wild-type retinas. In cep290fh297/fh297mutants, numerous vesicular structures and disorganized membranes are seen in cone outer segments (bracket). Rod outer segments are largely preserved and the connecting cilia are shown (white arrowheads). Scale bars: 10 μm (A-C); 2 μm (D, E). PHENOTYPE:
|
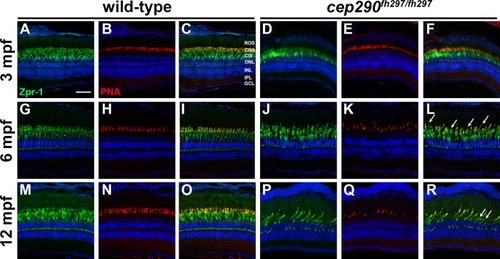
Cone outer segment degeneration progresses with age in cep290fh297/fh297mutants. Immunohistochemistry of retinal cryosections stained with peanut agglutinin (PNA) to label cone outer segments and Zpr-1 (green) to label red/green double cones of wild-type and cep290fh297/fh297 mutants. Views from dorsal retinas are shown. (A-F) Retinas from 3-month old adults. (G-L) Retinas from 6-month old adults. (M-R) Retinas from 12-month old adults. Arrows denote cones that were negative for PNA but positive for Zpr-1. ROS, rod outer segments; COS, cone outer segments; CIS, cone inner segments; ONL, outer nuclear layer; INL, inner nuclear layer; IPL, inner plexiform layer; GCL, ganglion cell layer. Scale bar: 50 μm.
|
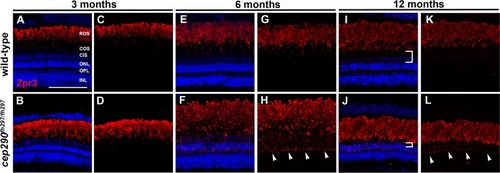
Mislocalization of rhodopsin in cep290fh297/fh297 mutants. (A-D) Images show cryosections labeled with Zpr3 (red) to mark rhodopsin and DAPI (blue) to label nuclei in the dorsal retinas from cep290fh297/fh297 mutants and wild-type siblings at 3 months of age; (E-H) 6 months of age, and (I-L) 12 months of age. At later ages, the distance between the base of the rod outer segments and the outer nuclear layer decreases due to loss of cone nuclei (I, J; white brackets). Arrowheads note rhodopsin mislocalization. ROS, rod outer segments; COS, cone outer segments; CIS, cone inner segments; ONL, outer nuclear layer; OPL, outer plexiform layer; INL, inner nuclear layer. Scale bar: 100 μm. |
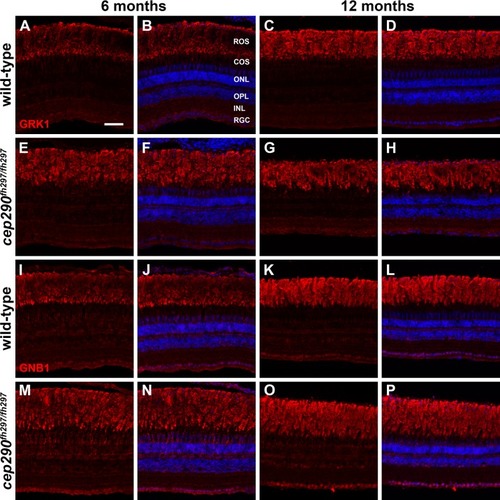
Immunolocalization of GRK1 and GNB1 in cep290fh297/fh297 mutants at 6 and 12 months of age. Retinal cryosections of cep290fh297/fh297 mutants and wild-type siblings were stained with polyclonal antibodies against rhodopsin kinase (A-H; GRK1) or with GNB1 polyclonal antibodies against the β subunit of rod transducin (I-P) to label rod outer segments at both 6 and 12 months of age. ROS, rod outer segments; COS, cone outer segments; ONL, outer nuclear layer; OPL, outer plexiform layer; INL, inner nuclear layer; RGC, retinal ganglion cells. Scale bar: 50 μm. EXPRESSION / LABELING:
|
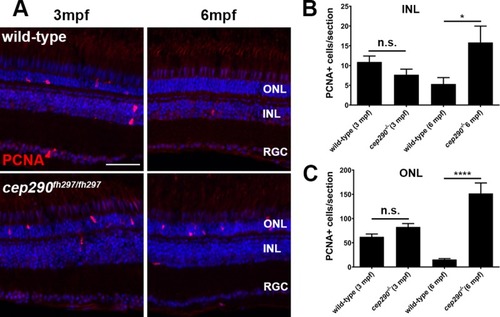
PCNA localization in cep290fh297/fh297 mutants at 3 and 6 months of age. (A) PCNA immunolocalization in cryosections of the dorsal retina of wild-type (top) and cep290fh297/fh297 mutants (bottom) at 3-months and 6-months of age. (B) PCNA positive cells were quantified in the INL from cryosections of the both dorsal and ventral retina at different ages. (C) Quantification of PCNA in the ONL from cryosections across the dorsal and ventral retina at different ages. A significant increase in PCNA immunoreactivity was seen in both the INL and ONL of cep290fh297/fh297 mutants at 6 months of age. Quantification was performed on cryosections of individual retinas from cep290fh297/fh297 mutants (n = 6) and wild-type siblings (n = 5) at the stated ages. Values represent the mean ± s.e.m. *P < 0.05; **** P < 0.0001 as determined by an unpaired t-test. ONL, outer nuclear layer; INL, inner nuclear layer; RGC, retinal ganglion cells. Scale bar: 50 μm.
PHENOTYPE:
|
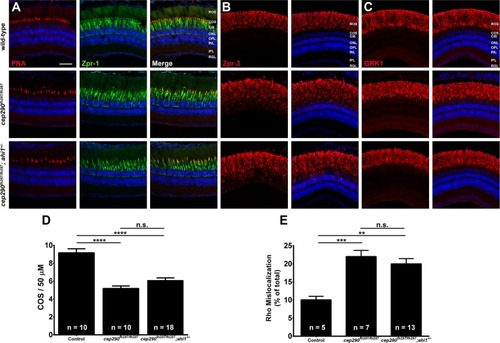
Combined loss of cep290 and ahi1 does not exacerbate cone degeneration or rhodopsin trafficking defects. Panels show immunohistochemical analysis of dorsal retinas from wild-type (top), cep290fh297/fh297 (middle), and cep290fh297/fh297;ahi1+/- mutants (bottom) at 6 months of age stained with (A) PNA (red) and Zpr-1 (green) to label cone photoreceptor; (B) Zpr-3 to label rhodopsin; or (C) GRK1 to label rhodopsin kinase. ROS, rod outer segments; COS, cone outer segments; ONL, outer nuclear layer; OPL, outer plexiform layer; INL, inner nuclear layer; IPL, inner plexiform layer; RGC, retinal ganglion cells. Scale bar: 50 μm. (D) Quantification of cone outer segment density or (E) rhodopsin mislocalization from the indicated genotypes at 6 months of age. See methods section for details on quantification. Removing one allele of ahi1 from a cep290fh297/fh297 mutant background had no effect on cone degeneration or rhodopsin mislocalization. At least 5 unique fish over at least 2 independent experiments were evaluated. **P < 0.01; *** P < 0.0005; **** P < 0.0001 as determined by a 1-way ANOVA with a Multiple Comparisons test and Tukey corrections. Data represented as means ± s.e.m.
|
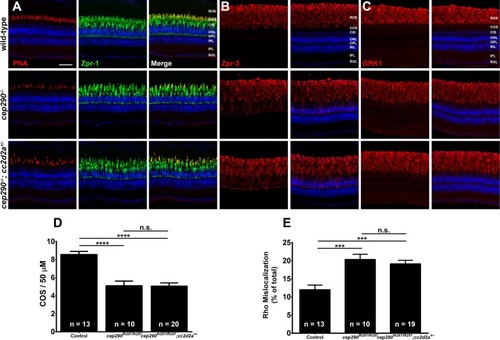
Combined loss of cep290 and cc2d2a does not exacerbate cone degeneration or rhodopsin trafficking defects. Panels show immunohistochemical analysis of dorsal retinas from wild-type (top), cep290fh297/fh297 (middle), and cep290fh297/fh297;cc2d2a+/- mutants (bottom) at 6 months of age stained with (A) PNA (red) and Zpr-1 (green) to label cone photoreceptor; (B) Zpr-3 to label rhodopsin; or (C) GRK1 to label rhodopsin kinase. ROS, rod outer segments; COS, cone outer segments; ONL, outer nuclear layer; OPL, outer plexiform layer; INL, inner nuclear layer; IPL, inner plexiform layer; RGC, retinal ganglion cells. Scale bar: 50 μm. (D) Quantification of cone outer segment density or (E) rhodopsin mislocalization from the indicated genotypes at 6 months of age. See methods section for details on quantification. Removing one allele of cc2d2a from a cep290fh297/fh297mutant background had no effect on cone degeneration or rhodopsin mislocalization. At least 10 unique fish over at least 2 independent experiments were evaluated. *** P < 0.0005; **** P < 0.0001 as determined by a 1-way ANOVA with a Multiple Comparisons test and Tukey corrections. Data represented as means ± s.e.m. |

Combined loss of cep290 and arl13b does not exacerbate cone degeneration or rhodopsin trafficking defects. Panels show immunohistochemical analysis of dorsal retinas from wild-type (top), cep290fh297/fh297 (middle), and cep290fh297/fh297;arl13b+/- mutants (bottom) at 6 months of age stained with (A) PNA (red) and Zpr-1 (green) to label cone photoreceptor; (B) Zpr-3 to label rhodopsin; or (C) GRK1 to label rhodopsin kinase. ROS, rod outer segments; COS, cone outer segments; ONL, outer nuclear layer; OPL, outer plexiform layer; INL, inner nuclear layer; IPL, inner plexiform layer; RGC, retinal ganglion cells. Scale bar: 50 μm. (D) Quantification of cone outer segment density or (E) rhodopsin mislocalization from the indicated genotypes at 6 months of age. See methods section for details on quantification. Removing one allele of arl13b from a cep290fh297/fh297mutant background had no effect on cone degeneration or rhodopsin mislocalization. At least 5 unique fish over at least 2 independent experiments were evaluated. ** P < 0.001; *** P < 0.0005; **** P < 0.0001 as determined by a 1-way ANOVA with a Multiple Comparisons test and Tukey corrections. Data represented as means ± s.e.m. |

ZFIN is incorporating published figure images and captions as part of an ongoing project. Figures from some publications have not yet been curated, or are not available for display because of copyright restrictions. PHENOTYPE:
|
|
Unillustrated author statements |