
- Title
-
Analysis of the genomic architecture of a complex trait locus in hypertensive rat models links Tmem63c to kidney damage
- Authors
- Schulz, A., Müller, N.V., van de Lest, N.A., Eisenreich, A., Schmidbauer, M., Barysenka, A., Purfürst, B., Sporbert, A., Lorenzen, T., Meyer, A.M., Herlan, L., Witten, A., Rühle, F., Zhou, W., de Heer, E., Scharpfenecker, M., Panáková, D., Stoll, M., Kreutz, R.
- Source
- Full text @ Elife
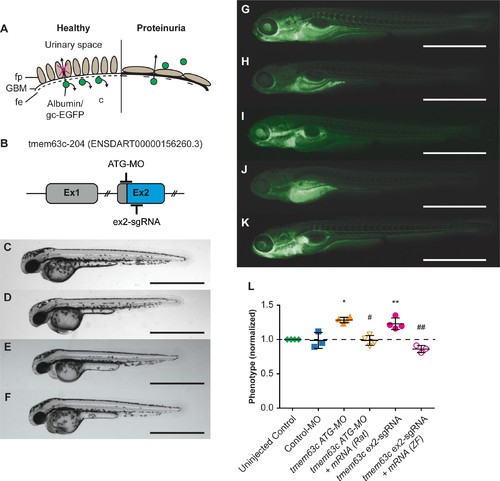
Functional assessment of the glomerular filtration barrier (GFB) after loss of transmembrane protein 63c (tmem63c) in zebrafish.(A) Scheme of the GFB in healthy and albuminuric zebrafish embryos. Green fluorescent protein (gc-EGFP) represents an albumin surrogate and is filtrated after impairment of the GFB. fe, fenestrated endothelium; fp, foot processes of podocytes; GBM, glomerular basement membrane. (B) Schematic of tmem63c showing the target regions in Exon 2 (ex2) used for Morpholino (MO)- and CRISPR/Cas9-mediated somatic mutagenesis. (C–F) Bright field view of wildtype embryos at 48 hr post-fertilization (hpf) in uninjected controls (C), ATG-MO injected (D), 159.6 ng/µl ex2-sgRNA injected (E), and 250 ng/µl ex2-sgRNA injected embryos (F). Scale bar = 1 mm. (G–K) Fluorescence microscopy of Tg[fabp10a:gc-EGFP] embryos at 120 hpf. Uninjected control with clearly visible gc-EGFP fluorescence in the trunk vasculature (‘fluorescent’) (G). tmem63c ATG-MO-injected embryo with partial or a complete loss of trunk fluorescence (‘deficient-fluorescent’) (H) and tmem63c ATG-MO +Tmem63c mRNA (Rat) co-injected embryo (I) showing rescue of the phenotype. Tmem63c ex2-sgRNA-injected embryo with partial or a complete loss of trunk fluorescence (‘deficient-fluorescent’) (J) and tmem63c ex2-sgRNA + tmem63c mRNA (ZF) co-injected embryo (K) showing rescue of the phenotype. Scale bar = 1 mm. (L) Analysis of gc-EGFP in the trunk vasculature. Shown are embryos categorized as ‘deficient-fluorescent’ (df), see Materials and method section and Figure 7—figure supplement 2 for details. Experimental groups are normalized to the corresponding uninjected control group per experiment. Uninjected Control (n = 1198); Control-MO (n = 189); tmem63c ATG-MO (n = 227); tmem63c ATG-MO +Tmem63c mRNA (Rat) (n = 230); tmem63c ex2-sgRNA (n = 371); tmem63c ex2-sgRNA + tmem63c mRNA (ZF) (n = 126); One-way ANOVA with Bonferroni’s multiple comparisons test. Values plottet: mean ±SD, dashed line at y = 1 indicates the uninjected control level; *p=0.0002 vs. uninjected Control, #p<0.0001 vs. tmem63c ATG-MO. **p=0.0014 vs. uninjected Control, ##p<0.0001 vs. tmem63c ex2-sgRNA. Data points in the graph represent the ratio per independent experiment, %(Uninjected Control (df)) / %(experimental group (df)), N ≥ 3. (See Figure 7—figure supplement 1 and Figure 7—figure supplement 2). |

Functional assessment of the glomerular filtration barrier (GFB) in Tg[fabp10a:gc-EGFP] zebrafish embryos.(A–C) Representative fluorescence microscopy pictures of Tg[fabp10a:gc-EGFP] zebrafish embryos categorized as ‘fluorescent’ or ‘deficient-fluorescent’, respectively to assess functionality of the GBM. An embryo of the ‘fluorescent group’ (A) shows clearly visible fluorescence in the trunk vasculature. (B–C) Embryos of different fluorescence intensities both characterized as ‘deficient-fluorescent’ with marked decrease in the fluorescence in the trunk vasculature. (D) Plot of mutagenesis output in transmembrane protein 63 c (tmem63c) crispants as created by CrispR Variants Lite analysis of the sequencing data from individual embryos. The gene schematic at the top illustrates the location of the sgRNA in red with respect to all overlapping transcripts on the reference strand in the Ensembl database (Yates et al., 2016). The panel below shows the pairwise alignment of each variant to the reference genome. The 20 bp sgRNA and the 3 bp PAM sequences are indicated in boxes in the reference sequence, the cutting site is indicated by a vertical line. Deletions are given by “- “and insertions by symbols with the inserted sequences shown underneath the plot with respect to the cutting site. The right panel demonstrates the frequency of the variants in the embryos analyzed with colors corresponding to variant frequencies as shown. The header displays the total number of embryos sequenced. (E–I) Functional assessment of the GFB after tmem63c-knockdown using tmem63c ex2-sdMO. (E) Schematic of tmem63c showing the region in Exon 2 (ex2) targeted by ex2-sdMO. Arrows indicate the positions of primers used for RT-PCR. (F) RT-PCR showing tmem63c-deficiency after injection of tmem63cex2-sdMO, but not in Control-MO injected embryos or uninjected Controls, respectively. Eukaryotic translation elongation factor 1 alpha 1, like 1 (eef1a1l1) is used as a loading control. (F–G) Bright-field view of wildtype embryos at 48 hr post-fertilization (hpf) in uninjected controls (F) and tmem63c ex2-sdMO injected embryos (G). Scale bar = 1 mm. (H) Analysis of gc-EGFP in the trunk vasculature. Shown are embryos categorized as ‘deficient-fluorescent’ (df). Experimental groups are normalized to the corresponding uninjected control group per experiment. Uninjected Control (n = 457); tmem63c ex2-sdMO (n = 297); tmem63c ex2-sdMO + tmem63 c mRNA (ZF) (n = 246); One-way ANOVA with Bonferroni’s multiple comparisons test. Values plottet: mean ±SD, dashed line at y = 1 indicates the uninjected control level; *p=0.0039 vs. uninjected Control, # p=0.0021 vs. tmem63c ex2-sdMO. ZF = zebrafish. Data points in the graph represent the ratio per independent experiment, %(Uninjected Control (df)) / %(experimental group (df)), N ≥ 3. PHENOTYPE:
|

Excerpt from sequence alignment of tmem63c mRNA zebrafish (NM_001159836) vs Tmem63c mRNA rat (NM_001108045.1).Sequence alignment shows the first 100 bp of tmem63c mRNA zebrafish vs. Tmem63c mRNA rat following ATG. Orange bases indicate the zebrafish sequence following ATG targeted by tmem63c ATG-MO to prove no targeting of rat mRNA by the used tmem63c ATG-MO. Sequence identity is 65,82% (Clustal 2.1) for mRNA sequences or 53,52% (Clustal 2.1) for protein sequences, respectively. D., Danio; R., Rattus. |
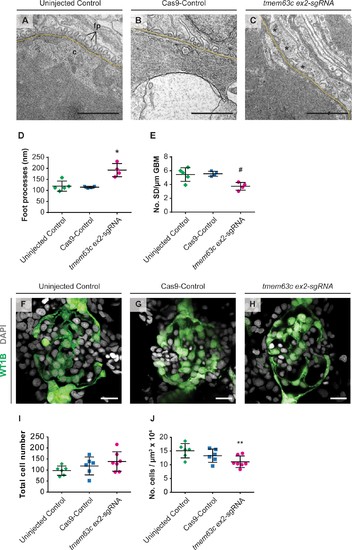
Ultrastructural and morphological analysis of glomerular structures after loss of tmem63c in zebrafish.( A–E) Electron microscopy and quantitative assessment of GFB ultrastructure. Representative electron microscopy pictures of the GFB in uninjected Controls ( A), Cas9-Controls ( B) and after tmem63c knockdown ( C), asterisks indicate effaced podocyte foot processes). Quantitative analysis of podocyte foot process width ( D) and number of slit diaphragms per µm GBM ( E). Uninjected Control ( n = 5); Cas9-Control ( n = 4); tmem63c ex2-sgRNA ( n = 4); Scale bar = 1 µm; values plottet: mean ±SD; One-way ANOVA with Bonferroni’s multiple comparisons test; *p=0.0019 vs. uninjected Control, *p=0.0017 vs Cas9-Control; # p=0.0171 vs. uninjected Control , # p=0.0148 vs. Cas9-Control. ( F–J) Confocal microscopy and analysis of absolute and relative podocyte cell number in Tg(wt1b:EGFP) at 96 hpf. Representative confocal microscopy pictures of glomeruli in uninjected Controls ( F), Cas9-Controls ( G) and after tmem63c knockdown ( H). Quantitative analysis of absolute ( I) and relative ( J) podocyte cell number. Relative podocyte cell number has been obtained after normalization to the glomerular volume. Uninjected Control ( n = 6); Cas9-Control ( n = 6); tmem63c ex2-sgRNA ( n = 7); Scale bar = 15 µm; values plottet: mean ±SD; One-way ANOVA with Bonferroni’s multiple comparisons test; **p=0.0421 vs. uninjected Control. |