
- Title
-
Phagosomal and mitochondrial alterations in RPE may contribute to KCNJ13 retinopathy
- Authors
- Toms, M., Burgoyne, T., Tracey-White, D., Richardson, R., Dubis, A.M., Webster, A.R., Futter, C., Moosajee, M.
- Source
- Full text @ Sci. Rep.

Retinal structure and function in obetd15 zebrafish. (a) Wholemount morphology of adult wild-type (WT) and obetd15zebrafish. (b) Retinal histology of obetd15 zebrafish at 3, 6 and 12 months post fertilization (mpf). (c) Expression of kcnj13mRNA (green) in the WT adult zebrafish retina detected using an RNAscope assay. Sections are counterstained with DAPI nucleic acid stain (blue). (d) Visual acuity (cycles per degree) of obetd15 zebrafish at 3, 6 and 12 mpf, measured using optokinetic response assay (minimum n = 4, mean ± SEM). (e) Retinal thickness (µm) of obetd15 zebrafish at 3, 6 and 12 mpf, measured using OCT (n = 5 for each age, mean ± SEM). GCL, ganglion cell layer; IPL, inner plexiform layer; INL, inner nuclear layer; OPL, outer plexiform layer; ONL, outer nuclear layer; IS/OS, outer and inner segments; RPE, retinal pigment epithelium. *p < 0.05, **p < 0.01. Scale bars = 50 μm (b) and 25 μm (c). |
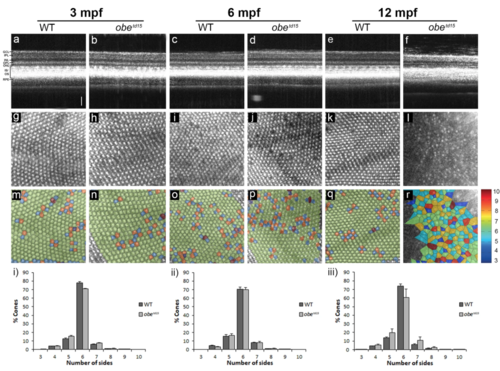
Cone photoreceptor mosaic in obetd15 zebrafish. Optical coherence tomography was used at 3, 6 and 12 months post fertilization (mpf) to examine retinal cross-sectional views (a–f), en face cone photoreceptor mosaics (g–l) and corresponding Voronoi domain overlays (m–r) in which a Voronoi polygon is associated with each cone photoreceptor and color-coded according to the number of sides it possesses (color key shown on right). Bar charts showing the mean percentage of 3- to 10-sided Voronoi domains in wild-type (WT) and obetd15 zebrafish at (i) 3 mpf, (ii) 6 mpf and (iii) 12 mpf (n = 5 for each age, mean ± SEM). GCL, ganglion cell layer; IPL, inner plexiform layer; INL, inner nuclear layer; OPL, outer plexiform layer; ONL, outer nuclear layer; PR, photoreceptors; RPE, retinal pigment epithelium. Scale bar = 50 μm. PHENOTYPE:
|

Increased mitochondrial abundance and altered phagosome clearance in the retinal pigment epithelium (RPE) of obetd15zebrafish. TEM cross-sections of the RPE show little difference at 3 months post fertilization (mpf) (a,b), while at 6 mpf (c,d) and 12 mpf (e,f) there is a significant increase in the number of mitochondria (M) in obetd15 compared to wild-type (WT) eyes. Additionally, there is a significant increase in the number of phagosomes (P) in obetd15 eyes at 3 mpf and 6 mpf. Bar charts displaying numbers of phagosomes and mitochondria per µm length of RPE are shown in (g,h). OS, photoreceptor outer segments; BM, Bruch’s membrane. Results are mean ± SEM (n = 3). **p < 0.01, ***p < 0.001. Scale bars = 2 µm. PHENOTYPE:
|

Increased mitochondrial size in the retinal pigment epithelium (RPE) of obetd15 zebrafish. Mitochondrial size in the wild-type (WT) RPE at (a) 3 months post-fertilisation (mpf), (c) 6 mpf and (e) 12 mpf shows a decrease with age, while mitochondrial size in the obetd15 RPE at (b) 3 mpf, (d) 6 mpf and (f) 12 mpf shows an increase with age. Mitochondrial area measured from TEM images displayed on bar chart (g). Results are mean ± SEM. 13 mitochondria measured per WT and mutant age group. Statistical significance relative to WT of different ages †p < 0.05, ††p < 0.01. Statistical significance relative to WT against obetd15 of the same age. ***p < 0.001. Scale bar = 200 nm. PHENOTYPE:
|
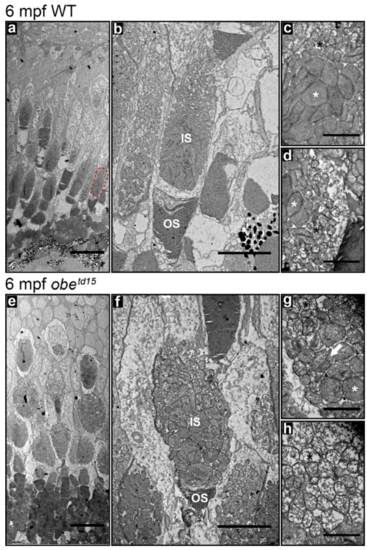
Altered mitochondrial morphology in the obetd15 cone photoreceptors. Ultrastructural examination of the cone photoreceptors in 6 months post fertilization (mpf) wild-type (WT) (a–d) and obetd15 fish (e–h). A red-green cone inner segment is highlighted on (a) (red dotted circle). Higher magnification images showed an altered morphology of the mitochondria in the obetd15 red-green cone inner segments (f–h). Electron-lucent mitochondria (black asterisks) were enlarged and electron-dense mitochondria (white asterisks) were rounder and less closely packed. The electron-dense mitochondria had juxtaposition of the cristae membranes (white arrow). IS, inner segments; OS, outer segments. Scale bars = 20 µm (a,e), 5 µm (b,f) and 1 µm (c,d,g,h). PHENOTYPE:
|

Melanosome localization in the obetd15 retinal pigment epithelium (RPE) in normal and dark-adapted conditions. TEM images of wild-type (WT) (a–d) and obetd15 (e–h) RPE at 3 months post fertilization (mpf), 6 mpf and 12 mpf with neighbouring panels showing digitally extracted melanosomes with the basal RPE-localized melanosomes false-colored in red. Using these extracted melanosomes, the proportion of melanosomes localized to the photoreceptor region was calculated, shown in bar chart (i). There was little difference in the proportion of melanosomes localised to the apical photoreceptor region of the RPE in zebrafish exposed to a normal daily light cycle. Whereas, dark-adaptation (DA) of 12 mpf obetd15 zebrafish (h) caused significantly more melanosomes to localize to the basal region of the RPE compared to WT zebrafish eyes (d). Results are the mean (from three regions from three eyes) ± SEM. *p < 0.05. Scale bars = 10 µm. PHENOTYPE:
|

ZFIN is incorporating published figure images and captions as part of an ongoing project. Figures from some publications have not yet been curated, or are not available for display because of copyright restrictions. |

Retinal stress in obetd15 zebrafish. Immunostaining of the retina at 3, 6 and 12 mpf using anti-ZRF1 to detect expression of glial fibrillary acidic protein (red), counterstained with DAPI nucleic acid stain (blue) (a). Quantitative RT-PCR was used to determine relative mRNA expression levels of sod1 (b), sod2 (c) and bcl2a (d) genes at 6 and 12 mpf (n = 3 for each age, mean ± SEM). Western blot analysis of heat shock protein 60 (hsp60) expression (e). The blot was re-probed with anti-β-actin as a loading control for samples. Bands of interest are cropped from full-length blot presented in Supplementary Fig. S4. The bar chart (f) shows mean ± SEM result from three independent experiments. *p < 0.05. Scale bar = 50 µm. |