
- Title
-
Endothelin receptor Aa regulates proliferation and differentiation of Erb-dependent pigment progenitors in zebrafish
- Authors
- Camargo-Sosa, K., Colanesi, S., Müller, J., Schulte-Merker, S., Stemple, D., Patton, E.E., Kelsh, R.N.
- Source
- Full text @ PLoS Genet.

ZFIN is incorporating published figure images and captions as part of an ongoing project. Figures from some publications have not yet been curated, or are not available for display because of copyright restrictions. EXPRESSION / LABELING:
PHENOTYPE:
|
|
ZFIN is incorporating published figure images and captions as part of an ongoing project. Figures from some publications have not yet been curated, or are not available for display because of copyright restrictions. PHENOTYPE:
|
|
ZFIN is incorporating published figure images and captions as part of an ongoing project. Figures from some publications have not yet been curated, or are not available for display because of copyright restrictions. EXPRESSION / LABELING:
PHENOTYPE:
|
|
ZFIN is incorporating published figure images and captions as part of an ongoing project. Figures from some publications have not yet been curated, or are not available for display because of copyright restrictions. |
|
ZFIN is incorporating published figure images and captions as part of an ongoing project. Figures from some publications have not yet been curated, or are not available for display because of copyright restrictions. |
|
ZFIN is incorporating published figure images and captions as part of an ongoing project. Figures from some publications have not yet been curated, or are not available for display because of copyright restrictions. PHENOTYPE:
|
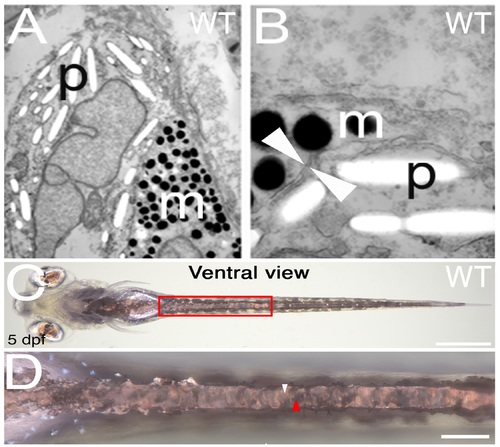
Melanocytes and iridophores in the WT yolk sac stripe are consistently separated from each other by double membranes.Transmission electron photomicrographs of melanocytes and iridophores in the WT yolk sac stripe ectopic pigment cells in pde mutants. A and B show two examples of melanosomes (m) and reflecting. platelets (p) separated by a double membrane (white arrowheads). Bright-field image of ventral view (C) and close up of the area in the red box (D) of WT fish, shows yolk sac stripe. Continuous layer of iridophores is indicated by white arrowhead in D, closely associated black melanocytes forming contiguous layer immediately dorsal to iridophores is indicatted by red arrowhead. Scale bars = 500 μm (C) and 100 μm (D). |
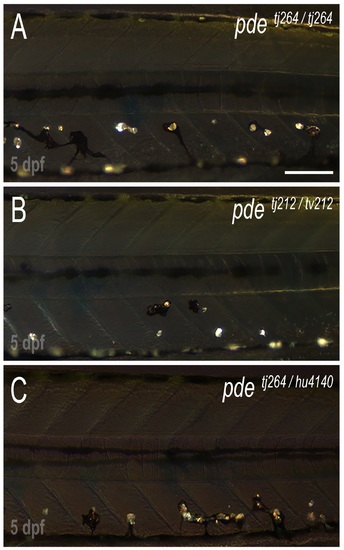
Complementation assay of the pde alleles.Overview of early larval pigment phenotype at 5 dpf of pdetj262/tj262 (A), pdetj262/tv212 (B) and pdetj262/hu4140(C). All three allele combinations show ectopic melanocyte and iridophores in the ventral medial pathway of the posterior trunk. |

Migration of neural crest cells through the medial migratory pathway.Labelling of neural crest derivatives with GFP using the transgenic line Tg(-4725sox10:cre)ba74; Tg(hsp:loxp-dsRed-loxp-LYN-EGFP) shows no difference between 35 hpf WT fish (A) and pde mutants (B), neural crest cells migrate ventrally in a intersegmental arrangement (white line in A and B). 5 dpf pde mutant larvae show ectopic pigment cells (white arrow in D) associated with the spinal nerve projections (arrowheads in D) that emerge from the dorsal root ganglia (DRG). Ectopic pigment cells (white arrows) are also associated with the sympathetic ganglion (SyG) chain that forms perpendicular to the spinal nerve projections (white arrowhead in E and F) and ventral to the notochord (No). Guided by DIC image, dorsal edge of the dorsal aorta (DA) is highlighted with a dashed white line in C-F. Neural tube (NT). DAPI labels nuclei (blue). Scale bar = 25 μm (A and B), 50 μm (C and D) and 15 μm (E-F). |
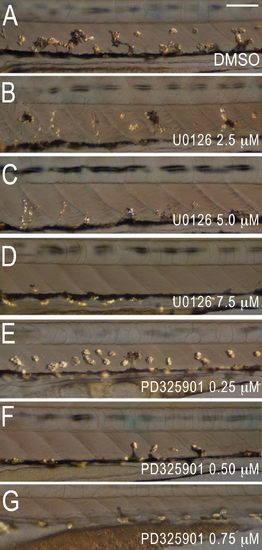
Inhibition of MEK rescues the pde phenotype.Treatment with increasing concentrations of the MEK inhibitors U0126 (2.5–7.6 μM) and PD 325901 (0.25–0.75μM), from 6–96 hpf, shows increasing rescue of the ectopic pigment cells. Scale bar = 100 μm (A-G). PHENOTYPE:
|

Expression of the Tg(mitfa:gfp) line in the ventral trunk of WT larvae.(A) Scheme shows 8 dpf fish, with the red box indicating the area where mitfa:gfp positive cells in the ventral trunk were found. (B) GFP+ cells are readily found in the vicinity of the dorsal aorta throughout the posterior trunk and anterior tail at 8 dpf; superimposed DIC image shows these cells are not melanised. (C) Quantitation of GFP+ cells from a random posterior trunk segment in each of 5 fish, given as mean±s.d. = 2.3±0.44 (n = 5). |