
- Title
-
Myosin Vb is required for correct trafficking of N-cadherin and cardiac chamber ballooning
- Authors
- Grassini, D.R., Da Silva, J., Hall, T.E., Baillie, G.J., Simons, C., Parton, R.G., Hogan, B.M., Smith, K.A.
- Source
- Full text @ Dev. Dyn.

uq 23ks mutants have chamber ballooning defects. A:Brightfield images of sibling and uq23ks mutants at 24 and 48 hpf and 4 dpf. Mutants manifest both cardiac (arrowhead) and fin defects (asterisks) at 48 hpf. B: Close up views of the cardiac defect shows the small, dysmorphic heart that does not balloon correctly in mutants and the pericardial cavity is depressed. Fin folds also fail to develop (asterisks) and epithelial cells appear to extrude (arrow). C: ISH assays using myl7and myh6 probes highlight the myocardium, showing that mutants and siblings are indistinguishable at 28 hpf and appears by 36 and 48 hpf. nppastaining at 48 hpf shows no significant differences between siblings and mutants, indicating the myocardium is properly specified and not experiencing mechanical stress. PHENOTYPE:
|
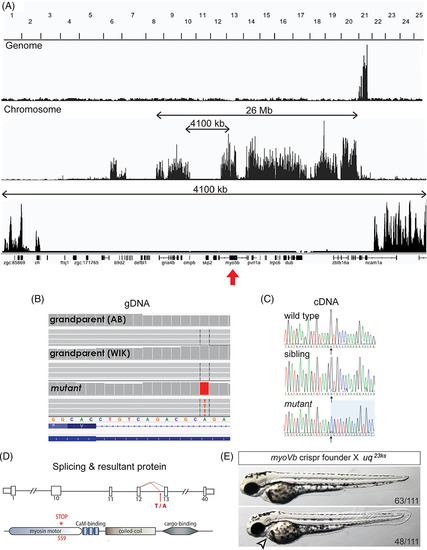
The uq 23ksphenotype is caused by a truncating mutation in myo5b. A: Whole genome sequencing based mapping of uq 23ksmutant showing linkage to Chromosome 21 and the linked region containing myo5b (red arrow). B:Sequence analysis identified a T/A transversion (A/T on negative strand shown), introducing a splice acceptor site in intron 12 of the myo5b gene, resulting in a 10 bp insertion at the beginning of exon 13. C: Sanger sequencing of myo5b cDNA encompassing the junction between exon 12 and exon 13 from wild‐type, sibling, and mutant embryos. D: Schematic representation of the mutation site in intron 12 and protein. E:Complementation analysis between a CRISPR/Cas9‐generated myoVbmutant founder and a uq 23kscarrier showing a failure to complement, including the cardiac phenotype (arrowhead), confirming myo5bas the mutated gene causing the uq 23ks phenotype |

myo5b mutant cardiomyocytes have increased recycling endosomes. A: Electron microscopic images of 36 hpf sibling and uq23ks mutant cardiomyocytes showing nonmitochondrial vesicles and tubular structures (blue arrows). M, mitochondria; Scale bar = 2.5 μm. B: Graph quantifying vesicles and tubular structures in siblings vs. mutant cardiomyocytes within 1 μm of the plasma membrane; mean ± SEM. C: Confocal imaging of recycling endosomes (labeled with RFP‐Rab11a) in sibling and mutant cardiomyocytes at 48 hpf. Cardiomyocyte membranes demarcated with white outline. D: Dot plot of the number of recycling endosomes per cell (as determined by RFP‐Rab11a‐postive particles), showing significantly more recycling endosomes in cardiomyocytes of uq23ks mutants vs. siblings. E: Histograms of recycling endosome size, showing significantly larger endosome size, consistent with endosome fusion. |

N‐cadherin is mislocalized in myo5b mutants and is increased in recycling endosomes. A:Time‐course imaging of N‐cadherin localization in sibling and myo5bmutant hearts at 32, 36, 48 hpf, and 4 dpf, shows N‐cadherin localization becoming disorderly at 36 hpf and clearly disorganized at 48 hpf. B: N‐cadherin staining in RFP‐Rab11a‐expressing hearts at 48 hpf shows N‐cadherin staining appears thicker (dotted perimeters in inset), consistent with persistence at the cytoplasm periphery. Co‐localization between RFP‐Rab11a and N‐cadherin staining (arrows), showing N‐cadherin localization within recycling endosomes. Mutant only insets: Single z‐scan showing N‐cadherin co‐localizing with RFP‐Rab11a (arrow) on the same confocal plane (Scale bar = 10 μm). C:Quantification of N‐cadherin staining area, normalized to cell size, shows significantly increased N‐cadherin staining area. D:Quantification of N‐cadherin and recycling endosome (RE) co‐localization shows significantly increased number of N‐cadherin‐positive recycling endosomes. mean ± s.e.m. *P < 0.05, **P < 0.01, ***P < 0.005. E,F:Live confocal z‐stack imaging of Tg(myl7:CherryCaax)transgenic sibling and myo5bmutant embryos at 48 hpf showing observable cell extrusions in mutant heart. Single z‐scans show no evident cell extrusions (E′,E″); however, single z‐scans from mutant embryos show several examples of cells extruding from the myocardial layer (F′,F″, arrowheads). These cell extrusions were observed in all mutant embryos imaged (n = 11) and not observed in any sibling controls (n = 5). |

Cardiomyocyte number is unchanged between siblings and uq 23ks mutants. A: Confocal imaging of sibling and uq 23ks mutants on the Tg(myl7:nls‐dsRed) background at 48 hpf. B: Dot plots quantifying the total number of cardiomyocytes observed in embryonic hearts show no significant (ns) difference between sibling and uq 23ks mutants at 48 hpf, suggesting a difference in cell proliferation or differentiation is not contributing to the uq 23ks phenotype. C: Quantification of cell number per area, however, is significantly higher in uq 23ks mutants compared with siblings, consistent with smaller cardiomyocyte size in uq 23ks mutants. mean ± SEM. n.s. = not significant; **P < 0.01. |

Cardiomyocytes fail to elongate, displaying mispatterned F‐actin in uq 23ksmutants. A:Confocal images of 48 hpf hearts immunostained for Alcama and stained with phalloidin to label F‐actin. Cardiomyocytes in mutant hearts remain small and round, as represented by the white shading in boxed zoom, whereas sibling OC cells elongate. F‐actin appears mislocalized in mutant cells, where it remains cortical, compared with wild‐type cells, where it traverses the cells. Alcama staining demarcating cell outlines was used to measure perimeter (B) and circularity (C) of OC cardiomyocytes. B: Dot plot of OC cardiomyocyte perimeter, showing a decrease in uq 23ksmutants compared with siblings C: Dot plots showing uq23ks mutant OC cardiomyocytes have increased circularity. D,E:Graphs comparing the profiles of the normalized signal intensity of phalloidin and Alcama staining in cardiomyocytes of sibling and mutant embryos at 48 hpf. Fluorescence intensities were measured at the short axis of a given cell (shown in F‐actin stained boxed zoom). F:Dot plot quantifying the difference between Alcama and phalloidin fluorescence profiles in wild‐type vs. mutant cardiomyocytes. Mean ± SEM. *P < 0.05, **P < 0.01. Scale bars = 50 μm in D; 20 μm in boxed zooms. OC, outer curvature. |
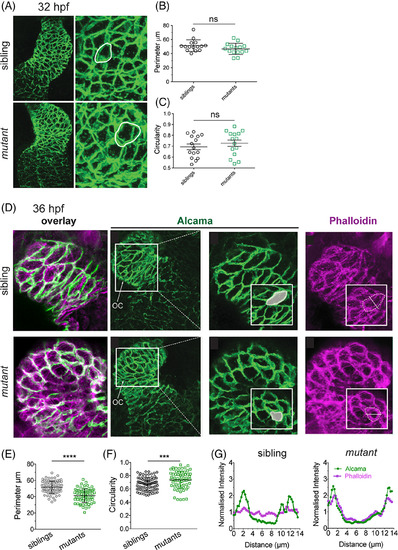
The uq 23ks mutant phenotype is first evident at 36 hpf. A: Confocal imaging of Alcama staining on 32 hpf embryos shows both chamber morphology (zoom out) and cardiomyocyte perimeter and circularity (white outlines) indistinguishable between sibling and uq 23ksmutants at 32 hpf. B: Dot plots depicting measurements of perimeter and (C) circularity of cardiomyocytes showing no significant difference (ns) between siblings and mutants at 32 hpf. D: Confocal images of Alcama and F‐actin staining on 36 hpf embryos show cardiomyocytes are smaller and more circular in uq 23ks mutants compared with siblings at 36 hpf. Phalloidin staining shows F‐actin failing to traverse cells and remaining cortical in uq 23ks mutants compared with siblings. E,F: Dot plots showing cell perimeter is decreased (e) and circularity is increased (F) in uq23ks mutants compared with siblings. G:Fluorescence intensity measurement across short diameter of cells (as depicted in phalloidin staining inset) showing poor correlation between Alcama and F‐actin in siblings but strong correlation in uq23ks mutants. |