
- Title
-
Transcriptome profiling of zebrafish optic fissure fusion
- Authors
- Richardson, R., Owen, N., Toms, M., Young, R.M., Tracey-White, D., Moosajee, M.
- Source
- Full text @ Sci. Rep.
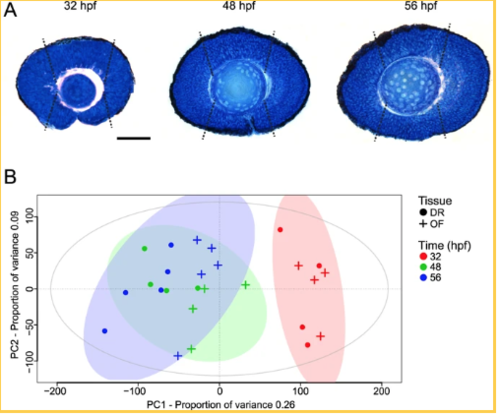
Optic fissure (OF) and dorsal retina (DR) tissue collection and principle component analysis (PCA). (A) Sagittal section through the zebrafish eye at the level of the lens at 32, 48 and 56 hpf, representative of before, during and after optic fissure fusion. White dotted lines indicate the tissue (inferior is optic fissure and superior is dorsal retina) harvested for RNA-seq transcriptome analysis. Scale bar 50 µm. (B) PCA of RNA-seq transcriptome data expression patterns using regularized-logarithm transformed count data in DESeq2. Time (hours post fertilization, hpf) is represented by colour and origin of tissue by shape. |

RNAscope in situ hybridisation for visualisation of selected differentially expressed gene (DEG) events from RNA-seq transcriptome analysis. Representative images of dual in situ hybridisation in the wild-type zebrafish retina using mRNA probes to (A–C) vax1 and bambia, (D–F) tbx3a and pax2a, and (G–I) rbp2a and pax2a at 32, 48 and 56 hpf. Nuclei were labelled with 4′,6-diamidino-2-phenylindole (DAPI). White dotted lines indicate the location of the lens. Scale bar 50 µm. |

Failure of optic fissure fusion in ntn1a morphant zebrafish embryos. Expression levels (TPM, transcripts per million) of ntn1a candidate DEG showing temporal expression at 32,48 and 56 hours post fertilization (hpf) (A). (B) Wholemount and ocular morphology of 56 hpf wildtype (wt) and ntn1a morphant embryos, showing loss of ntn1a results in an ocular coloboma phenotype, scale bar 500 µm. (C) Histological analysis confirming loss of optic fissure fusion in ntn1a morphants. Scale bar 50 µm. PHENOTYPE:
|
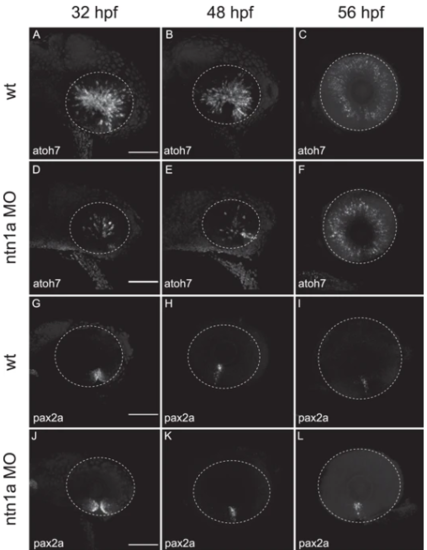
Expression analysis of ntn1a morphant embryos through optic fissure fusion. Representative images of in situ hybridisation in wild-type and ntn1a morphant zebrafish retina using mRNA probes for (A–F) atoh7 and (G–L) pax2a at 32, 48 and 56 hpf. White dotted lines indicate the circumference of the eye. Scale bar 50 µm. |