
- Title
-
A novel nonosteocytic regulatory mechanism of bone modeling
- Authors
- Ofer, L., Dean, M.N., Zaslansky, P., Kult, S., Shwartz, Y., Zaretsky, J., Griess-Fishheimer, S., Monsonego-Ornan, E., Zelzer, E., Shahar, R.
- Source
- Full text @ PLoS Biol.

Anosteocytic vertebra of medaka and osteocytic vertebra of zebrafish. High-resolution tomography of caudal vertebrae of zebrafish (left) and medaka (right). O, colored in black in the zebrafish scan, show the ubiquity of cells residing in the bone material of zebrafish while being completely absent from medaka bone material. Note that the distal parts of the NS and HS were cropped in the original scans and are only drawn here for reference; therefore, these parts do not contain lacunae in the zebrafish rendering. Inset images show unsegmented tomography slices at a higher magnification. The vertebrae of both species are hourglass shaped along the cranio–caudal axis (see 3D representation in Fig 3A), with NS and HS extending caudally from the vertebral body. HS, hemal spine; NS, neural spine; O, osteocytic lacunae. |
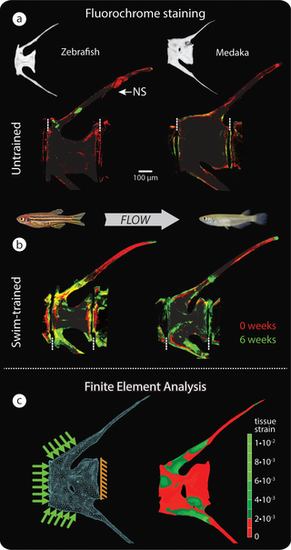
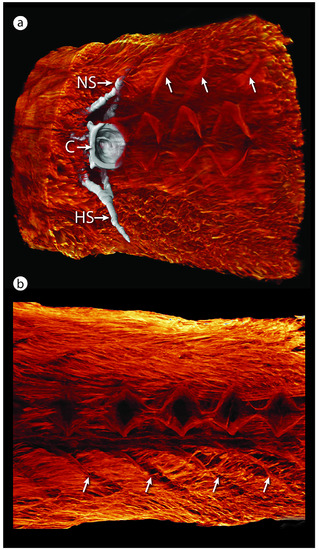
Vertebral bone formation in response to load. (a–b) Bone formation detected by sequential intraperitoneal fluorochrome injections in untrained (a) and swim-trained (b) zebrafish (left, osteocytic) and medaka (right, anosteocytic), each of the 4 groups comprising n = 4 fish. Alizarin red was injected at t = 0 weeks, and calcein green was injected at t = 6 weeks of swim training. Dashed, vertical white lines mark the border between vertebrae. (c) FE model (left) and FEA results (right), showing von Mises strains in a loaded medaka vertebra. Note similarity of peak strains predicted by FEA in (c) and regions of intense bone formation in response to load, indicated by fluorochrome double labeling (b). The distal HSs are cropped in fluorochrome and FE renderings. FE, finite element; FEA, finite element analysis; HS, hemal spine; NS, neural spine. |
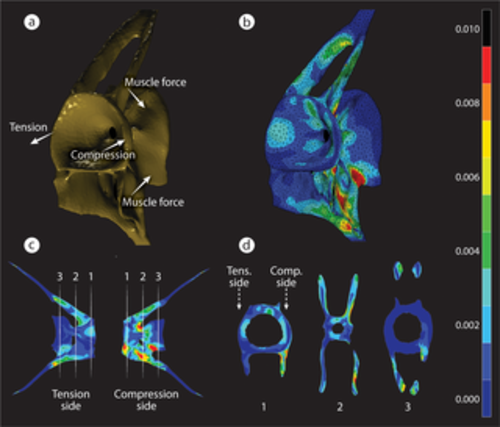
FEA of strain distribution in a loaded medaka vertebra. (a) A simplified loading graphic of the forces applied to the model. Lateral bending of the vertebral column during oscillatory swimming creates forces on the flat articular surfaces of adjacent centra, F Comp. on one side and F tens. on the opposite side. F Muscs acting on fish vertebrae are rather difficult to model because of the high complexity of the musculature as shown in S1 Fig and are represented here in a simplified manner. (b) 3D representation of von Mises strains in the vertebra. (c) Strain distribution in 2 contralateral views of a loaded vertebra. Locations of several transverse sections are marked by white dashed lines and are shown in (d). (d) Strain distribution in the 3 numbered 2D transverse sections shown in (c). Peak strains occur primarily near the external surfaces of the VB. Strain magnitudes (no units) for all images are shown in the color bar on the right. F Comp., compression force; FEA, finite element analysis; F Musc, muscle force; F Tens., tension force; VB, vertebral bone. |
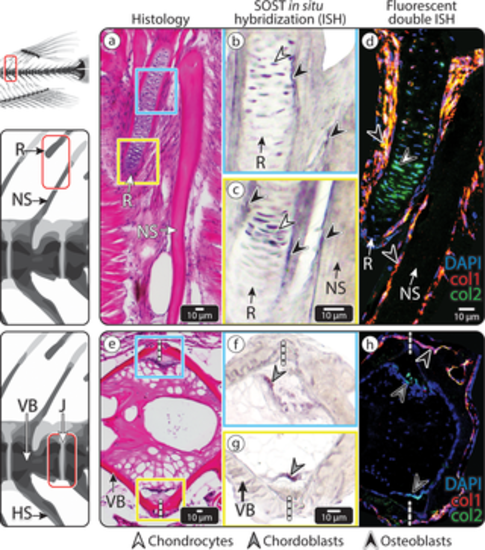
SOST expression in medaka vertebra and dorsal fin R. (a–d) An NS of medaka vertebra and adjacent fin R. (a) HE-stained section. The blue and yellow squares mark 2 regions in the dorsal fin R, shown in (b) and (c), respectively. (b–c) ISH showing SOST expression in the cartilaginous core of the dorsal fin R (white arrowheads) and surface osteoblasts of the fin R and NS (black arrowheads). (d) Double fluorescent ISH, showing both Col1a1 (red) and Col2a1 (green) expression in the SOST-positive osteoblasts (black arrowheads) of the NS and fin R and Col2a1 in the SOST-positive chondrocytes (white arrowhead) in the cartilaginous core of the fin R. (e–h) The IVR in the caudal vertebral column of medaka, (e) HE-stained section. The blue and yellow squares mark the 2 regions of the intravertebral region shown in (f) and (g), respectively. (f–g) ISH showing SOST expression in chordoblasts (gray arrowheads), identified by their distinct morphology and location. (h) Double fluorescent ISH in the IVR, showing Col1a1 expression (red) in osteoblasts (black arrowhead) in the external region of the IVR and Col2a1 expression (green) in SOST-positive chordoblasts (gray arrowhead) in the internal region of the IVR (scale bar same as in e). Dashed, vertical white lines mark the border between vertebrae. Results for individual stains (e.g., DAPI, SOST, col1, col2) are shown in S4 Fig. Col1a1, collagen type I alpha 1; Col2a1, collagen type II alpha 1; HE, hematoxylin–eosin; ISH, in situ hybridization; IVR, intervertebral region; J, joint; NS, neural spine; R, radial; VB, vertebral bone |
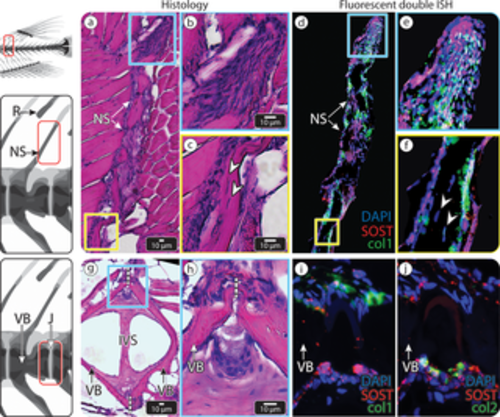
SOST expression in zebrafish vertebra. (a–f) An NS of zebrafish vertebra. (a) HE-stained section. The blue and yellow squares mark distal and proximal regions within the NS, respectively, shown at higher magnification in (b) and (c), respectively. (b) Higher magnification of the tip of the spine. (c) Higher magnification of the spine, showing osteocytes residing inside the bone material (white arrowheads). (d) Double fluorescent ISH showing both Col1a1 (green) and SOST (red) expression in surface cells of the NS, indicating they are SOST-positive osteoblasts. The blue and yellow squares correspond to the regions (b) and (c) in (a) and to (e) and (f). (e) The tip of the spine contains numerous SOST-positive osteoblasts and seems to serve as an active growth region. (f) Osteocytes (white arrowheads) do not appear to express SOST. (g–j) The IVR in the caudal vertebral column of zebrafish, (g) HE-stained sagittal section. Dashed white lines mark the border between one vertebra to another. The blue square marks the intravertebral region shown in (h–j) at higher magnification. (h) Magnification of the IVR, showing the J between 2 adjacent VBs and their distinct cell populations. (i) Double fluorescent ISH (SOST and Col1a1) identifies the upper cell population in (h) as osteoblasts since they express Col1a1a (green) and shows both the upper and lower cell populations to express SOST. (j) Double fluorescent ISH (SOST and Col2a1) shows the lower population of cells to be chordoblasts, based on their distinctive morphology location and expression of Col2a1(green). These cells also express SOST (red). Scale bars apply to all images of comparable regions (i.e., b and e; c and f; h, i, and j). Results for individual stains (e.g. DAPI, SOST, col1, col2) are shown in S5 Fig. Col1a1, collagen type I alpha 1; Col2a1, collagen type II alpha 1; HE, hematoxylin–eosin; ISH, in situ hybridization; IVR, intervertebral region; IVS, intervertebral space; J, joint; NS, neural spine; R, radial; VB, vertebral bone. EXPRESSION / LABELING:
|

Mechanical load and SOST down-regulation cause increased bone formation. (a) Double fluorescent ISH, showing SOST (red) and Col1a1 (green) in the spine and adjacent R of untrained (left) and trained (right) medaka (n = 3 for each group). In trained medaka, SOST expression appears down-regulated (as inferred from changes in staining intensity), while osteoblast recruitment is increased. (b) RT-qPCR results of SOST and Col1a1 expression after 1 hour (SOST: swim trained n = 5, untrained n = 7 and Col1a1: swim trained n = 4, untrained n = 6) and 10 days of swim training of medaka (for both SOST and Col1a1: swim trained n = 5, untrained n = 4), (compared to levels in untrained medaka: gray, horizontal “control” line). Results were normalized to the rlp-7 housekeeping gene. Asterisks indicate a significant difference (p < 0.05) between trained and untrained (control) fish. Original raw data can be found Data A. (c) Top: illustration of splice site blocking MO-binding site and primers used to detect morphant transcripts (E1, i1). Bottom: RT-PCR of medaka injected with standard control (C1, C2) and with SOST MO (MO1, MO2). Bands indicative of SOST splice blocking appeared in SOST MO-injected samples (black arrows) and not in the standard control samples. (d) Bone-formation dynamics marked by fluorochromes (red: alizarin red, injected at t = 0 weeks; green: calcein green, injected at t = 2.5 weeks) in vertebra of medaka injected with standard control MO (left) and SOST MO (right). Dashed, vertical white lines mark the border between vertebrae. NSs are cropped in fluorescence images in (d). Col1a1, collagen type I alpha 1; E1, exon-spanning forward primer; HS, hemal spine; ISH, in situ hybridization; i1, intron-spanning reverse primer; MO, vivo-morpholino; NS, neural spine; PCR, polymerase chain reaction; R, radial; RT-PCR, reverse transcription PCR; RT-qPCR, real-time quantitative PCR. |
Caudal is to the right in all images. (a) Sagittal section of a 3D reconstruction of contrast-enhanced (PTA) tomography showing the dense musculature surrounding the caudal vertebral column of medaka. One vertebra is segmented in white to show the full 3D muscle–vertebral relationship. The caudal faces of the vertebral C, NS, and HS are indicated. Neural arch muscular attachments are marked by white arrows. (b) Medial view of a sagittal section of medaka caudal musculature, with vertebrae digitally removed. The paravertebral musculature is complex and robust and occupies a large portion of the caudal part of the fish body, attaching mainly to the NS and HS and arches. Muscle fiber orientations and sites of attachment are clearly visible: intervertebral joints occupy the serial, diamond-shaped gaps in the musculature, and hemal arch muscular attachments are marked by white arrows. C, centrum; HS, hemal spine; NS, neural spine; PTA, phosphotungstic acid. |
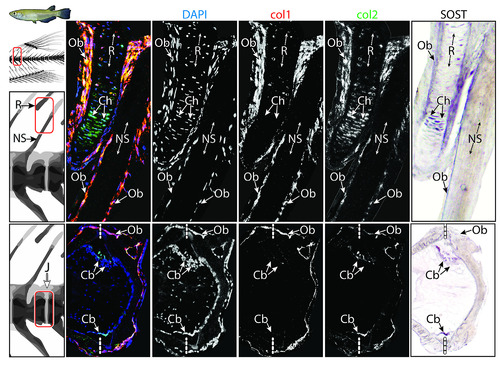
Top row: NS and adjacent fin R; bottom row: intervertebral J. Each row comprises (from left to right) a multichannel RGB double fluorescent ISH image, followed by isolated single-channel images (DAPI, col1, col2, respectively) and a SOST ISH image. The figure provides a deconstruction of the multichannel ISH images Fig 4. Note SOST-positive Cbs, Chs, and Obs and the lack of osteocytes within the NS. Refer to text for further results. Cb, chordoblast; Ch, chondrocyte; ISH, in situ hybridization; J, joint; NS, neural spine; Ob, osteoblast; R, radial; RGB, red-green-blue. |

Top row: NS and adjacent fin R; bottom row: intervertebral J. Each row comprises (from left to right) a multichannel RGB double fluorescent ISH image, followed by isolated single-channel images (DAPI, col1, col2, respectively) and a SOST ISH image. The figure provides a deconstruction of the multichannel ISH images in Fig 4. Note SOST-positive Cbs, Chs, and Obs and the lack of osteocytes within the NS. Refer to text for further results. Cb, chordoblast; Ch, chondrocyte; ISH, in situ hybridization; J, joint; NS, neural spine; Ob, osteoblast; R, radial; RGB, red-green-blue. |