
- Title
-
A Notch-mediated, temporal asymmetry in BMP pathway activation promotes photoreceptor subtype diversification
- Authors
- Cau, E., Ronsin, B., Bessière, L., Blader, P.
- Source
- Full text @ PLoS Biol.

Expression of exorh and parietopsin follows a temporal sequence. (A-D) In situ hybridization for exorh or parietopsin at 24 and 26 hpf. At 26 hpf, only 2 out of 10 embryos showed parietopsin+ cells; in these embryos, parietopsin expression is restricted to the center of the pineal territory. (E) Schematic representation showing the pineal territory in blue and nascent neurons in purple, indicating the orientation of the images in (A-D); dorsal view with the anterior to the top. (F) Counts of exorh+ and parietopsin+ cells in embryos of various stages, which are indicated on the x-axis. Error bars represent SD. Number of embryos analyzed are n = 6, 5, 11, and 5 for exorh+ cells at 24, 26, 28, and 30 hpf, respectively, and n = 10, 10, 21, and 5 for parietopsin+ cells at the same stages. Scale bar represents 15 μm. Underlying data can be found in S1 Data. exorh, exorhodopsin; hpf, hours post fertilization |

Impairing Notch activity modifies the timing of PhR differentiation and favors early PhR fate at the expense of late PhR fate. (A-B) Representative confocal sections showing the expression of the Tg(aanat2:gfp)y8(aanat2:gfp) transgene in Tg(hsp70l:dnXla.Rbpj-MYC)vu21 (referred to as Notch KD) and wt siblings at 42 hpf. (C-F) Expression of exorh and PT in Tg(hsp70l:dnXla.Rbpj-MYC)vu21 and siblings at 48 hpf (C-D) and 66 hpf (E-F). (G) Counts of Tg(aanat2:gfp)y8+ cells at various stages in Tg(hsp70l:dnXla.Rbpj-MYC)vu21 and siblings. The stage is indicated on the x-axis. (H) Counts of exorh+ and PT+ cells in Tg(hsp70l:dnXla.Rbpj-MYC)vu21 and sibling embryos after in situ hybridization. Stages are 48 hpf for exorh+ and 66 hpf for PT+ cells. Scale bars represents 10 μm. Heat shock was performed at 14 hpf. Error bars represent SD. *p < 0.05, **p < 0.001 using a Mann Whitney test. Underlying data can be found in S1 Data. exorh, exorhodopsin; hpf, hours post fertilization; KD, knock-down; PhR, photoreceptor; PT, parietopsin; wt, wild type. |
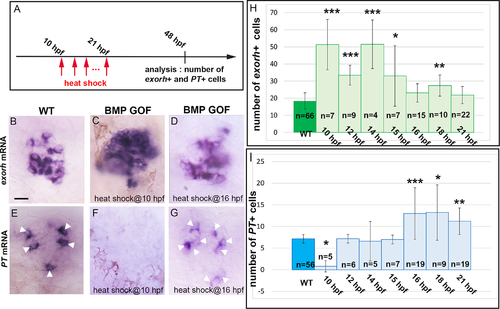
Activation of BMP signaling at different times affects PhR subtype identity. (A) Scheme of the experimental design showing the timing of the heat shocks and analysis of the number of exorh+ and PT+ cells. (B-G) In situ hybridization for exorh and PT in 48-hpf WT and Tg(hsp70:bmp2b)fr13 transgenic embryos (BMP GOF) heat shocked at 10 or 16 hpf. Embryos are viewed dorsally with anterior to the top. Scale bar represents 10 μm. (H-I) Counts of exorh+ and PT+ cells in WT and Tg(hsp70:bmp2b)fr13embryos after a heat shock performed at various stages (indicated on the x-axis). Error bars represent SD. *p < 0.05. **p < 0.001. ***p < 0.0005. ****using a Kruskal-Wallis test with Dunn’s post hoc comparisons of the transgenic versus WT populations. Tg(hsp70:bmp2b)fr13 transgenic embryos were labeled BMP GOF. Underlying data can be found in S1 Data. BMP, bone morphogenetic protein; exorh, exorhodopsin; GOF, gain of function; hpf, hours post fertilization; PhR, photoreceptor; PT, parietopsin; WT, wild type. |
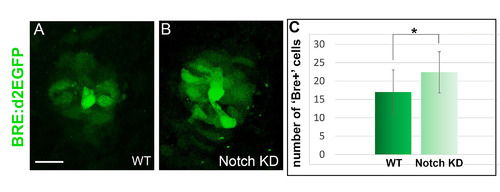
Alteration of Notch activity modifies the expression of the Tg(BMPRE-AAV.Mlp:d2EGFP)mw30transgene. (A-B) Confocal projections of WT and Tg(hsp70l:dnXla.Rbpj-MYC)vu21 (Notch KD) embryos at 22 hpf. Embryos are shown in dorsal views. The Tg(BMPRE-AAV.Mlp:d2EGFP)mw30 transgene (BRE:d2EGFP) is shown in green. Scale bar is 15 μm. (C) Counts of dGFP+ cells in WT and Tg(hsp70l:dnXla.Rbpj-MYC)vu21 (Notch KD) embryos at 23 hpf. Underlying data can be found in S2 Data. Heat shock was performed at 14 hpf. Error bars represent SD. *p < 0.05 using a t test. Underlying data can be found in S2 Data. D2EGFP, destabilized enhanced green fluorescent protein; KD, knock-down; hpf, hours post fertilization; WT, wild-type. |