
- Title
-
Venous identity requires BMP signalling through ALK3
- Authors
- Neal, A., Nornes, S., Payne, S., Wallace, M.D., Fritzsche, M., Louphrasitthiphol, P., Wilkinson, R.N., Chouliaras, K.M., Liu, K., Plant, K., Sholapurkar, R., Ratnayaka, I., Herzog, W., Bond, G., Chico, T., Bou-Gharios, G., De Val, S.
- Source
- Full text @ Nat. Commun.

The vein-specific Ephb4-2 enhancer recapitulates endogenous Ephb4 expression in fish and mouse. a Region around the human EPHB4 gene as seen on UCSC Browser. Within histone marks, the three tracks show the enhancer-associated H3K4Me1 and H3K27Ac and promoter-associated H3K4Me3 marks found in human umbilical vein endothelial cells as light blue peaks. Within DNaseI hypersensitivity, the heat maps show DNaseI hypersensitive (HS) regions found in different cell lines, with endothelial cells labelled in red and non-endothelial cells labelled in orange. The endothelial histone marks and endothelial-specific DNase I hypersensitivity indicate two potential endothelial enhancer regions (named -2 and -10, marked as red horizontal lines). b, c The Tol2 Ephb4-2:E1b:GFP transgene (b) directs venous expression of the green fluorescent protein (GFP) reporter gene in a transgenic zebrafish line also expressing the pan-endothelial kdrl:HRAS-mCherry (c). No enhancer activity (as detected by GFP expression) was seen in the dorsal aorta, whereas robust activity was detected in the cardinal and ventral veins. Expression is detected in all intersegmental vessels. White scale bars are 100 μm. Red bracket = dorsal artery; white bracket = axial veins; isv = intersegmental vein. d, e The Ephb4-2:hsp68:LacZ transgene (d) directs vein-specific expression of the LacZ reporter gene in transgenic mice (e) as compared to Ephb4LacZ/+. Black scale bars are 100 μm, grey scale bars are 500 μm, red scale bars are 1000 μm. isv = intersomitic vessel, cv = cardinal vein, da = dorsal aorta, jv = jugular vein, ca = carotid artery, ccv = common cardinal vein, cev = branches of the cerebral venous plexus, lv = left ventricle. EXPRESSION / LABELING:
|

Activity of the Ephb4-2 enhancer requires SMAD4. a Two sets of E10.5 Smad4+/+;Ephb4-2:LacZand Smad4EC/EC;Ephb4-2:LacZ littermates demonstrates loss of Ephb4-2 enhancer activity after loss of SMAD4 regardless of extent of growth retardation (n = 4 from 4 litters). Although some embryos exhibited severe growth retardation, similar sized younger embryos had robust Ephb4-2:LacZ expression (see Supplementary Fig. 5). Grey scale bars are 1000 μm. b, c Mutation of two composite SMAD-binding elements (SBE2/3 and SBE6/7) within the Ephb4-2 enhancer resulted in near-total loss of enhancer activity compared to wild-type enhancer in F0 transgenic zebrafish (b, mosaic due to nature of Tol2-mediated F0 transgenesis) and mice (c). Transverse section taken through the strongest lacZ-expressing F0 Ephb4-2mutSBE(2/3,6/7) embryo confirmed lack of vascular expression. Grey numbers in bottom right corner indicate the number of F0 mouse with similar expression patterns to the image shown. White and black scale bars both represent 100 μm, grey scale bars are 1000 μm. da = dorsal aorta, cv = cardinal vein, nt = neural tube; red bracket = dorsal artery; white bracket = axial veins. |

The Ephb4-2 enhancer is bound by SMAD1/5. a Mouse (m) and orthologous human (h) DNA sequence of the Ephb4-2 enhancer. Red nt on human sequence correspond to regions bound by SMAD1/5 as determined from SMAD1/5 human umbilical vein endothelial cell (HUVEC) chromatin immunoprecipitation-sequencing (ChIP-seq) data32 (see also Supplementary Fig. 6c). Green boxes denote GC-SBE motifs associated with SMAD1/5 binding, blue boxes denote SBE motifs associated with all SMAD binding and grey boxes denote other over-represented motifs (MEME1, 3 and 532). Black outlined boxes denote composite SBE/GC-SBE elements, italic nt indicate linker sequences. Grey text under sequences indicates motifs previously identified as the EBEs and SBEs in earlier analysis (Supplementary Fig. 4). For sequence logos of motifs, see Supplementary Fig. 6b. b SMAD1/5 HUVEC and PASMC ChIP-seq data from Morikawa et al.32 (red peaks = statistically significant peaks after BMP9 stimulation in HUVEC). Significant binding peaks are not observed in PASMC after BMP4 stimulation (green). See also Supplementary Fig. 6c). c Box and whiskers plot of ChIP-qPCR data shows significant enrichment of SMAD1 binding at the Ephb4-2 enhancer in BMP9-stimulated HUVECS (red) compared to a control intergenic region on the same chromosome (p = 0.00015, paired two-tailed t test). SMAD1 binding at the Ephb4-2 enhancer region is not enriched over control in the absence of BMP stimulation (green) (p = 0.19212). No enrichment is observed between IgG control regions (p = 0.3154 and p = 0.19212, paired two-tailed t test). Horizontal lines = medians, boxes = interquartile range (IQR); vertical lines = minimal/maximal values (up to 1.5× IQR) and black dots = data points outside of 3× IQR. Data represents three biological replicates each with three technical replicates performed in triplicate. All data points were included in statistical analysis. d, e Morpholino (MO)-mediated partial knockdown of smad1/5 on GFP expression in arterial tg(Dll4in3:GFP) (d) and venous tg(Ephb4-2:GFP) (e) transgenic zebrafish lines, using 0.5 ng smad1 MO and 0.25 ng smad5 MO. Graphs depict expression in all embryos, Dll4in3:GFP WT n = 58, MO n = 48; Ephb4-2:GFP WT n = 104, MO n = 84. High expression = solid colour, weak = pattern, absent = solid white. Zebrafish embryos shown are representative of the predominant phenotype, red bracket = dorsal aorta, white bracket = posterior cardinal and ventral vein(s). White scale bars represent 100 μm |

A SMAD1/5-binding peak identifies a vein endothelial enhancer for Coup-TFII. a UCSC browser view of COUP-TFII (NR2F2) incorporating SMAD1/5-binding data from Morikawa et al. A statistically significant SMAD1/5-binding peak in human umbilical vein endothelial cells (HUVECs) (red) −965 kb upstream of Coup-TFII correlated with the H3K27Ac enhancer histone mark in HUVECs (blue peaks) and endothelial HUVEC DNaseI hypersensitivity (black heat map). b, c Stable transgenic mouse (b) and zebrafish (c) embryos expressing the lacZ and GFP reporter genes, respectively, under the control of the murine CoupTFII-965 enhancer. In both animal models, enhancer activity was primarily seen in the venous endothelium. Black and white scale bars both represent 100 μm, grey scale bars are 500 μm, red scale bars are 1000 μm. a = artery, v = vein, cev = branches of cerebral venous plexus, cv = cardinal vein, pm = paraxial mesoderm, da = dorsal aorta, red bracket = dorsal aorta; white bracket = posterior cardinal and ventral vein(s). dTables summarizing reporter gene expression in transient transgenic zebrafish and mouse embryos after mutation of the core SMAD-binding element (SBE-PEAK). EXPRESSION / LABELING:
|

Notch-independent Alk3a/b signalling is involved in venous identity in zebrafish. a Loss of Notch signalling had no effect on the expression of the venous Ephb4-2:GFP transgene in tg(Ephb4-2:GFP) transgenic zebrafish. Representative 48 hpf embryos demonstrate similar intensities of vein-specific green fluorescent protein (GFP) expression in both control and DAPM-treated embryos. Red bracket = dorsal aorta, white bracket = posterior cardinal and ventral vein. Graph depicts observed expression pattern of GFP in tg(Ephb4-2:GFP) embryos for control (n = 51) and 100 µM DAPM-treated embryos (n = 57); black denotes high expression, grey denotes weak. See Supplementary Fig. 12 for Coup-TFII-965:GFP results and controls. b Morpholino (MO)-induced reduction of alk1 and alk2 had little effect on Ephb4-2:GFP expression in 48hpf tg(Ephb4-2:GFP) transgenic zebrafish, whereas reduction of alk3a/b resulted in significantly decreased transgene expression. Representative 48 hpf tg(Ephb4-2:GFP) embryos demonstrate reduced GFP expression after alk3a/b MO injection. Red bracket = dorsal aorta, white bracket = posterior cardinal and ventral vein. Graph depicts observed expression patterns of GFP for control (n = 51), alk1 MO (n = 45), alk2 MO (n = 45) and alk3a/b MO (n = 48); black denotes high expression, grey denotes weak expression and white denotes no detectable GFP expression. c Whole-mount in situ hybridization for bone morphogenetic protein (BMP) receptors alk3a and alk3b compared to pan-endothelial kdrl in wild-type zebrafish embryos at 20, 24, 28 and 36 hpf. Earlier time points can be seen in Supplementary Fig. 13. Both alk3a and alk3b were detected in the axial vein but not in the artery, with greater early expression seen for alk3b. Red bracket = axial artery, blue bracket = axial vein. d Whole-mount in situ hybridization for BMP ligands bmp2b and bmp4compared to pan-endothelial kdrl in wild-type zebrafish embryos at 28 hpf. Both bmp2b and bmp4 showed stronger expression around the axial veins comparative to the dorsal artery. Red bracket = axial artery, blue bracket = axial vein. All scale bars represent 100 μm. See also Supplementary Figures 12–13 EXPRESSION / LABELING:
PHENOTYPE:
|

Identification and analysis of the Ephb4-2 and Ephb4-10 enhancers. a. The 5’ upstream region of the human EPHB4 gene as seen on UCSC Browser (http://genome.ucsc.edu). Histone marks (light blue) and DNase I hypersensitivity (HS, peaks shown as a heat map, different cell type names written on left with endothelial lines denoted in red) are concentrated around the two putative enhancers, marked as -2 and -10 and by red horizontal lines. Conservation between the human sequence and mouse, manatee, chicken, xenopus and zebrafish is indicated by black vertical lines, demonstrating that neither enhancer is conserved beyond manatee. b. Probability weight matrices from JASPAR showing the consensus binding motifs for ERG, ETV2 and SMAD (referred to in text as the SBE). Red boxes denote the core base pairs used for analysis of Ephb4-2 and Ephb4-10 sequences. Dotted line denotes additional base pairs considered to decide which EBE most adhered to consensus. c-d. ClustalW alignment of the Ephb4-2 (c) and Ephb4-10 (d) mouse and human enhancer sequence annotated with conserved ETS binding elements (EBE, yellow) and SMAD binding elements (SBE, blue). Numbers refer to mutations analysed in Figure 5 and Supplementary Fig. 5. Bold EBE refer to those that adhere to a more stringent consensus binding motif denoted by red dashed lines in b. Base-pairs mutated in mutCONT transgene are denoted in orange text. e. IGV browser view of 5’ region of EPHB4 gene and upstream sequence incorporating ERG ChIP-seq data from Fish et al10. Both Ephb4 putative enhancers (red horizontal bars) have significant ERG binding peaks in HUVECs (yellow peaks). f. Table summarizing Ephb4-2:GFP and Ephb4-10:GFP transgene activity as detected by GFP expression in 48hpf transient transgenic zebrafish. g-j. Relating to Fig. 4c, expression in the transgenic zebrafish line tg(Ephb4-2:GFP; kdrl:HRAS-mCherry) as shown by representative embryos at 20hpf (g), 24hpf (h), 36hpf (i) and 96hpf (j). a=dorsal aorta, v=dorsal/ventral veins. |

Ephb4-2 enhancer activity requires SMAD4. a. X-gal expression in comparably sized Smad4EC/EC;Ephb4-2:LacZ and Smad4+/+;Ephb4-2:LacZ transgenic embryos. b. Representative transverse sections taken through the torso at the base of the heart from E10.5 Smad4+/+ and Smad4EC/EC embryos also transgenic for Ephb4- 2:LacZ. Cv indicates cardinal vein, da indicates dorsal aorta (section shown for Smad4EC/EC embryo can be directly compared to Fig. 1b to confirm da identification). c. Table summarizing the reduction of GFP expression pattern in transient transgenic zebrafish after mutations of SMAD binding elements (SBE), and other conserved regions (CONT), comparative to Ephb4-2:GFP wild-type. The numbers after SBE and EBE correlate to the motifs highlighted in Supplementary Fig. 4c, mutated nt in CONT are marked in orange text in Supplementary Fig. 4c. d. Representative 48hpf transient transgenic zebrafish expressing wild type and mutated Ephb4-2 sequences detailed in c. e. Table summarizing the reduction of X-gal expression pattern in transient transgenic mice expressing Ephb4-2mutSBE(2,3/6/7):LacZ, in which two composite SMAD binding motifs have been mutated, compared to Ephb4-2:LacZ wild-type. |

MO-mediated SMAD1/5 knock-down in tg(Ephb4-2:GFP) and tg(Dll4in3:GFP) transgenic zebrafish a. Morpholino (MO)-mediated depletion of smad1/5 in zebrafish lines transgenic for the Dll4in3:GFP arterial and Ephb4-2:GFP venous enhancers at 36hpf. The graphs depict observed expression in all embryos (Dll4in3:GFP WT n=60 MO n=64; Ephb4- 2:GFP WT n=67, MO n=86). High expression levels are represented by solid colour, weak levels by pattern and absent expression by solid white. Zebrafish embryos shown are representative of the predominant phenotype, red bracket=dorsal aorta, white bracket=posterior cardinal and ventral vein(s). b-c. Dose-response analysis of Ephb4-2:GFP expression and morphology using different concentrations of smad1 and smad5 morpholinos. Representative embryos are shown in b, and expression patterns summarized in c. 0.25ng smad1MO/0.125ng smad5MO embryos n=52 at 36hpf, 52 at 48hpf; 0.5ng smad1MO/0.25ng smad5MO embryos n=48 at 36hpf, n=86 at 48hpf; 0.1ng smad1MO/0.5ng smad5MO embryos n=32 at 36hpf, n=49 at 48hpf. d. Expression of Ephb4-2:GFP in zebrafish after loss of blood flow downstream of morpholino-mediated depletion of tnnt2. Graph depicts observed expression pattern of GFP in tg(Ephb4-2:GFP) embryos for control (n=46) and tnnt2-MO injected embryos (n=47), black represents high expression, grey represents weak, white represents absent expression. |
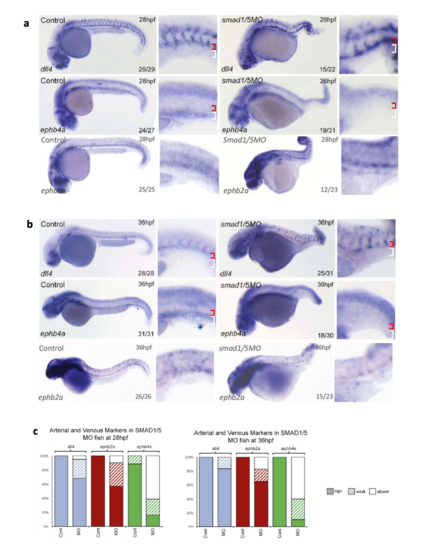
Expression of endogenous ephb4a, dll4 and ephb2a in zebrafish after MOmediated smad1/5 knockdown. a-c. Expression of dll4, ephb2a and ephb4 as detected by whole-mount in situ hybridization after morpholino (MO)-mediated depletion of Smad1/5 at both 28hpf (a) and 36hpf (b). Graph (c) depicts observed expression of dll4 (blue), ephb2a (red) and ephb4a (green) in all embryos. At 28hpf, dll4 WT n=29 MO n=22, ephb2 WT n=25 MO n=23, ephb4a WT n=27 MO=31; at 36hpf dll4 WT n=31 MO ephb2a WT n=26 MO=23, ephb4a WT n=31 MO n=30). High expression levels are represented by solid colour, weak levels by pattern and absent expression by solid white. Zebrafish embryos shown are representative, values on the bottom right indicate number of embryos with the displayed phenotype per total number of embryos analysed, red bracket=dorsal aorta, white bracket=posterior cardinal and ventral vein(s). |

The CoupTFII-965 enhancer is active in zebrafish a-c Relating directly to Figure 7c, further representative fish from the stable transgenic line tg(CoupTFII-965:GFP;kdrl:HRAS-mCherry) at 24hpf (a), 48hpf (b) and 72 hpf (c, partially also shown in Fig. 7c). d. IGV view of the human sequence orthologous to the Coup-TFII enhancer and surrounding region. Morikawa et al. 11 SMAD1/5 ChIP-seq data in HUVEC (BMP9 stimulated) is displayed as Bam coverage (pink peaks), Bam reads (grey boxes) and Bedgraph (red peaks). The exact sequence corresponding to Bam coverage peaks is shown in full, mouse sequence on top, human sequence on bottom, * denoting conserved bp . Motifs are marked: SBE (blue), GC-SBE (green) and other SMAD1/5- bound MEMEs (grey). EXPRESSION / LABELING:
|

Perturbation of signalling through Notch, ERK/MAPK and BMPR2 has little effect on the activity of Ephb4-2, while inhibition of ALK1/2/3/6 reduces Ephb4- 2 activity. a. Representative 36 and 48hpf tg(Ephb-2:GFP) zebrafish after DMSO alone (control) or addition of the ERK inhibitor SL327 demonstrate that Ephb4-2:GFP expression does not expand into the artery after ERK inhibition. Although high levels of SL327 inhibit arterial formation, both dorsal aorta and dorsal/ventral veins were clearly visible (using circulation) in fish after 15uM SL327 added at 24hpf. (n=40 for all groups). b. Representative 48hpf tg(Coup-TFII-965) and tg(Dll4in3:GFP) zebrafish after DMSO alone (Coup-TFII n=51, Dll4 n=42 ) or 100uM DAPM treatment (Coup-TFII n=57, Dll4 n=54) demonstrate that Notch inhibition does not change Coup-TFII965:GFP expression intensity or venous localization. As previously reported after Notch pathway inhibition, hypersprouting was clearly visible (red box denotes zoomed region), particularly in the tg(Dll4in3:GFP) zebrafish. c. Representative 42hpf tg(Ephb-2:GFP) zebrafish without treatment (control, picture shown is from bmpr2a injection set) or after injection of bmpr2a MO (control n =30, MO n =32), bmpr2b MO (control =35, MO n= 25), combined bmpr2a/b MO (control n=40, MO n=40) and dab2 MO (control n=51, MO n=45) Ephb4-2:GFP expression was detected in all, although defects in the sprouting from the caudal vein were detected as previously described by 5,6. d. Inhibition of BMP signalling by DMH1 severely reduces the expression of the venous Ephb4-2:GFP transgene in zebrafish. Graph depicts observed expression pattern of GFP in tg(Ephb4-2:GFP) embryos for DMSO-treated control (n=42) and 5µM DMH1-treated embryos (n=68), black represents high expression, grey represents weak, white represents no detected expression. Embryos shown are representative 36hpf tg(Ephb4-2:GFP) embryos after control and DMH1-treatment embryos. |
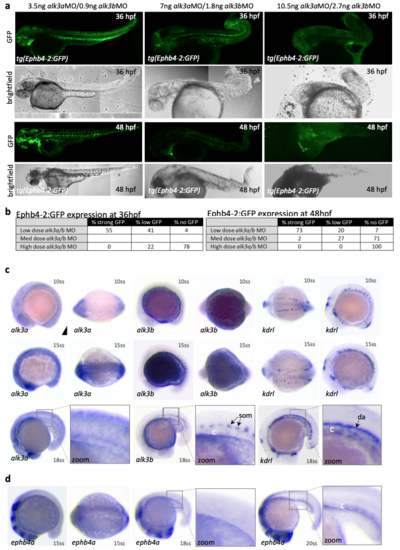
alk3a/b is required for Ephb4-2 expression and is expressed in the early zebrafish axial vein a-b. Directly relating to Fig. 8b. Dose-response analysis of Ephb4-2:GFP expression and morphology using different concentrations of alk3a and alk3b morpholinos. Representative embryos are shown in a and expression patterns summarized in b. 3.5ng alk3aMO/0.9ng alk3bMO embryos n=54 at 36hpf, 51 at 48hpf; 14ng alk3aMO/2.7ng alk3bMO embryos n=32 at 36hpf, n=55 at 48hpf. c. Whole-mount in situ hybridization for alk3a and alk3b expression compared to pan-endothelial kdrl in wild type zebrafish embryos at 10, 15 and 18 somite stage (ss). d. Whole-mount in situ hybridization for ephb4a expression in wild type zebrafish embryos at 15 and 18 and 20 somite stage (ss). |
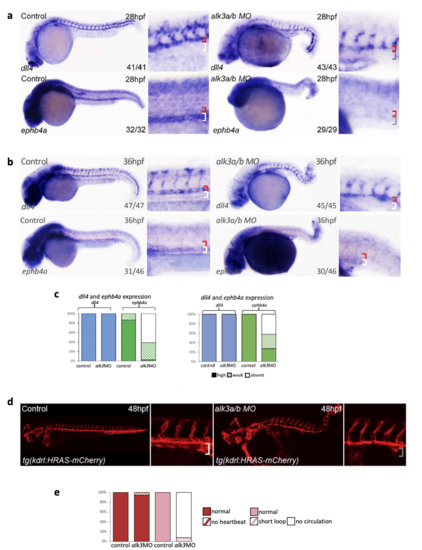
MO-induced depletion of alk3a/b results in loss of endogenous ephb4a and disrupted circulation with no clear axial vessels. a-c. Whole mount in situ hybridization for dll4 and ephb4a in zebrafish after morpholino (MO)-mediated depletion of alk3a/b at 28hpf (a) and 36hpf (b). Graph (c) depicts observed expression of dll4 (blue) and ephb4a (green) in all embryos (at 28hpf, dll4 WT n=41 MO n=43, ephb4a WT n=32 MO=29; at 36 hpf, dll4 WT n=47 MO n=45, ephb4a WT n=46 MO=46), high levels of expression are represented by solid colour, weak levels by pattern and absent expression by solid white. Zebrafish embryos shown are representative, values on the bottom right indicate number of embryos with the displayed phenotype per total number of embryos analysed. d. Combined alk3a/alk3b knockdown resulted in the loss of a detectable axial vein at 48hpf as seen using the pan-vascular tg(kdlr:HRAS-mCherry) transgenic fish line. e. Graph depicts observed status of heartbeat and circulation loop in control (n=90) and alk3a/b MO injected (n=106) fish. Normal heartbeat is represented by solid red, no heartbeat by pattern red, normal circulation is represented by solid pink, the presence of a short loop shown by pattern and no circulation by solid white. Zebrafish embryos shown are representative, red bracket=dorsal aorta, white bracket=posterior cardinal and ventral vein, grey bracket=absent vein. |