
- Title
-
A longitudinal assessment of host-microbe-parasite interactions resolves the zebrafish gut microbiome's link to Pseudocapillaria tomentosa infection and pathology
- Authors
- Gaulke, C.A., Martins, M.L., Watral, V.G., Humphreys, I.R., Spagnoli, S.T., Kent, M.L., Sharpton, T.J.
- Source
- Full text @ Microbiome
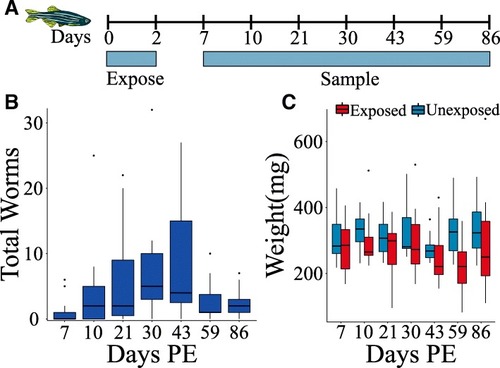
Sampling strategy and physiological manifestations of |
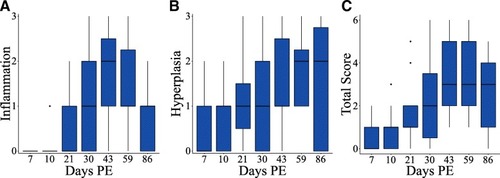
Longitudinal histopathological changes during |

Pathologic changes in fish infected with Pseudocapillaria tomentosa. Hematoxylin and eosin stained sections of parasite exposed and unexposed intestines (a-f). a A representative unexposed, control fish with minimal cellularity in the lamina propria and numerous goblet cells (arrows). b Intestine of a P. tomentosa-exposed fish at 7 dpe exhibiting mild hyperplasia (score 1) and containing numerous larval worms (arrows). c An exposed fish at 59 dpe exhibiting severe hyperplasia (score 3)with increased basilar nuclei (E) extending to near the brush border in some locations, numerous rodlet cells (arrows), and expanded lamina propria (L) due to chronic inflammation. d Chronic inflammation, inflammation score 3, with extensive expansion of the lamina propria (L), largely dysplastic epithelium (E), and loss of epithelial cell polarity (hyperplasia score 3) in a exposed fish at 59 dpe. e Extensive flattening of epithelial folds (E) and moderate expansion of lamina propria (L) due to chronic inflammation (hyperplasia 3, inflammation 2) at 86 dpe. f A carcinoma in an exposed fish at 86 dpe with neoplastic epithelial cells proliferating in the lamina propria (L), invading through tunica muscularis (M), and nests of neoplastic cells (S) present in the serosa. Scale bars=50 μm |

|
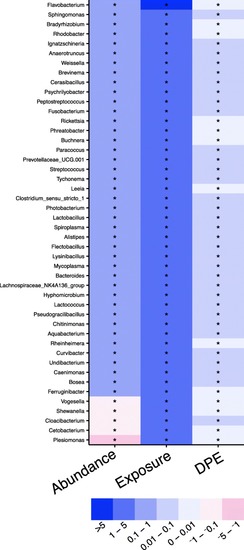
Parasite burden is associated with microbial abundance. A heat map of coefficients from negative binomial generalized linear models with lowest AIC. The color of each cell represents the direction of the slope (red is negative, blue is positive). An asterisk in a cell indicates |

Microbial abundance is associated with parasite burden and histopathology. A heat map of coefficients from converged zero-inflated negative binomial generalized linear mixed effects models with lowest AIC. The color of each cell represents the direction of the slope (red is negative, blue is positive). Gray colored cells indicate that a model without an interaction parameter was selected as it had the lowest AIC. An asterisk in a cell indicates |