
- Title
-
Distinct Levels of Reactive Oxygen Species Coordinate Metabolic Activity with Beta-cell Mass Plasticity
- Authors
- Ahmed Alfar, E., Kirova, D., Konantz, J., Birke, S., Mansfeld, J., Ninov, N.
- Source
- Full text @ Sci. Rep.
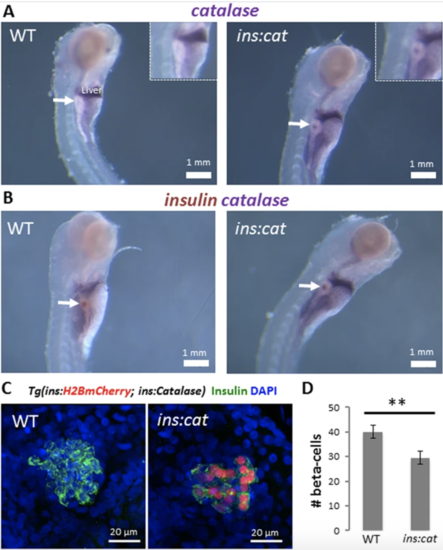
Catalase expression in beta-cells leads to a reduction in beta-cell numbers in larvae. (A) Whole mount in situ hybridization (WISH) for catalase in WT and Tg(ins:catalase;ins:H2BmCherry) larvae at 5 dpf. Arrows point to the principal islet. Catalase expression was not detected in the beta-cells of WT larvae whereas Tg(ins:catalase;ins:H2BmCherry) larvae exhibit catalase transcripts. (B) Double WISH for insulin (brown) and catalase (purple) showing overlap between the insulin and catalase transcripts in Tg(ins:catalase;ins:H2BmCherry) siblings. (C) Confocal projections of the principal islets of 4 dpf WT and Tg(ins:catalase;ins:H2BmCherry) larvae. (D) Quantification of the average number of beta-cell in WT (n = 15 larvae) and Tg(ins:catalase;ins:H2BmCherry) larvae (n = 12 larvae). Tg(ins:catalase;ins:H2BmCherry) larvae exhibit a reduced beta-cell number compared to WT (p = 0,008, error bars = SEM).
|
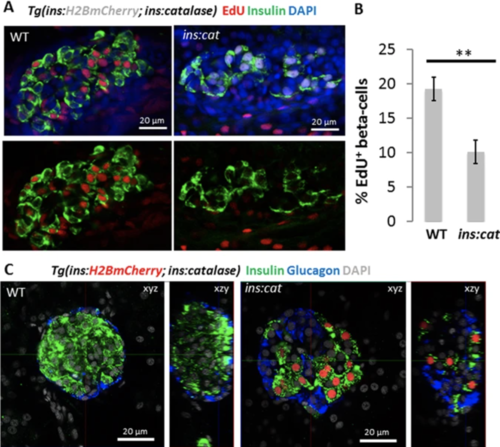
Catalase expression in beta-cells reduces beta-cell proliferation. (A) Confocal sections of principal islets from WT and Tg(ins:catalase;ins:H2BmCherry) siblings, incubated at 21 dpf with EdU for 16 hours (5 h after feeding). Fewer beta-cells incorporated EdU in Tg(ins:catalase;ins:H2BmCherry) compared to WT siblings. (B) Quantification of the percentage of EdU+ beta-cells in WT (n = 10) and Tg(ins:catalase;ins:H2BmCherry) (n = 11). Expression of catalase leads to a reduced percentage of EdU+ beta-cells compared to WT (p = 0,001). (C) Confocal planes (xzy) and 3D reconstructions (xzy) of smaller islets from WT and Tg(ins:catalase;ins:H2BmCherry) animals stained for insulin and glucagon. The beta-cells in the islet of the Tg(ins:catalase;ins:H2BmCherry) were scattered and fewer in numbers compared to WT. Alpha-cells in Tg(ins:catalase;ins:H2BmCherry) appear unaffected by the catalase expression in beta-cells. See also Figure S2 for maximum projections spanning the volume of principal islets in WT and Tg(ins:catalase;ins:H2BmCherry). Error bars = SEM.
EXPRESSION / LABELING:
PHENOTYPE:
|

Different levels of H2O2 induce beta-cell proliferation and quiescence. (A) Quantification of the number of Tg(ins:FUCCI-S/G2/M)+ beta-cells after continuous treatment with increasing concentrations of H2O2 from 3 to 4 dpf. The treatment with 50 μM H2O2 (n = 89 larvae) increased the number of Tg(ins:FUCCI-S/G2/M)+ beta-cells compared to controls (n = 104 larvae) (p = 0.025) whereas the treatments with 500 and 1000 μM H2O2 decreased the number of Tg(ins:FUCCI-S/G2/M)+ beta-cells (n = 38 larvae for 500 H2O2 μM; n = 63 larvae for controls; p = 0.03) (n = 46 larvae for 1000 μM H2O2; n = 78 larvae for controls; p = 0.0004). (B) Quantification of the number of Tg(ins:FUCCI-S/G2/M)+ beta-cells in 3 dpf larvae treated with increasing concentrations of H2O2 for 1.5 hours followed by a wash-out. The number of Tg(ins:FUCCI-S/G2/M)+ beta-cells was examined 24 hours after the initiation of the treatment. The short treatment with 200 and 500 μM H2O2 increased the number of Tg(ins:FUCCI-S/G2/M)+ beta-cells compared to controls (n = 51 larvae for 200 μM H2O2; n = 86 larvae for controls; p = 0.02) (n = 68 larvae for 500 μM H2O2; n = 96 for larvae for controls; p = 0.02). (C) Confocal projections of the principal islets of 4 dpf Tg(ins:H2B-GFP; ins:dsRED) larvae treated from 3 to 4 dpf with 50 μM H2O2. (D) Quantification of the average number of beta-cells marked with H2B-GFP in controls and H2O2-treated larvae. H2O2-treatement increased beta-cell number (n = 30 larvae) compared to controls (n = 26 larvae) (p = 0,046). Error bars = SEM. (E) Bar chart showing the increase in the number of INS-1 cells after H2O2 or NAC-treatments. Data from four independent experiments and > 3.5 × 10⁵ cells per condition were normalized to the mean of control treated cells ( = 100%) and analyzed for significance using a one-way ANOVA with Dunnett’s multiple comparison test. Error bars indicate S.E.M. Cartoons with permission by Luis Delgadillo. EXPRESSION / LABELING:
PHENOTYPE:
|
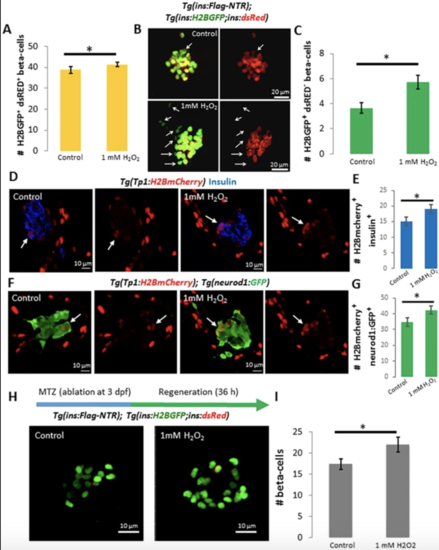
High levels of H2O2 promote new beta-cell neogenesis and regeneration. (A) Quantification of the average number of beta-cells marked with H2B-GFP in controls (n = 22) and larvae treated with 1 mM H2O2 from 3 to 4 dpf (n = 23). The larvae treated with 1 mM H2O2 exhibit an increase in the number of beta-cells compared to controls (p = 0,04). (B) Confocal projections of the principal islet of 4 dpf WT and Tg(ins:H2B-GFP; ins:dsRED) larvae treated with vehicle or 1 mM H2O2 from 3 to 4 dpf. Arrowheads point to H2B-GFP+ dsRED− cells. (C) Quantification of the number of H2B-GFP+ and dsRED− cells in controls and H2O2-treated larvae. Beta-cells that are H2B-GFP+ but dsRED− represent recently-formed cells due to the slower maturation of dsRED compared to GFP. H2O2-treatment increased the number H2B-GFP+ and dsRED− beta-cells compared to controls (p = 0,004), indicating an increase in new beta-cell formation. Error bars = SEM. (D) Confocal sections of primary islets from Tg(Tp1:H2BmCherry) larvae stained for insulin (blue). Tg(Tp1:H2BmCherry) drives expression of a fluorescent protein with long half-life (H2BmCherry) in the Notch responsive cells (NRCs) in the pancreas. Beta-cells that differentiate from NRCs can retain H2BmCherry-flurescence due to perdurance. The larvae were treated with vehicle or 1 mM H2O2 from 3 to 4 dpf. The arrows indicate Tp1:H2BmCherry+ and insulin+ cells in the periphery of the primary islets in controls and H2O2-treated larvae. See Figure S6 for higher resolution images. (E) Quantification of the average number of Tp1:H2BmCherry+ and insulin+ cells in the principal islets of controls (n = 21) and H2O2-treated larvae (n = 19), showing an increase following the H2O2-treatement (p = 0,049). (F) Confocal sections of primary islets from Tg(Tp1:H2BmCherry); Tg(neurod1-GFP) larvae. The arrows indicate Tp1:H2BmCherry+ and GFP+ cells in the periphery of the primary islets in controls and H2O2-treated larvae. See Figure S7 for higher resolution images. (G) Quantification of the average number of Tp1:H2BmCherry+ and GFP+ cells in the principal islets of controls (n = 21) and H2O2-treated larvae (n = 19), showing an increase following the H2O2-treatement (p = 0,046). (H) Confocal projections of Tg(ins:FLAG-NTR); Tg(ins:H2B-GFP;ins:dsRED) larvae. Beta-cells were ablated by incubating larvae in MTZ at 3 dpf. Subsequently, the larvae were treated with vehicle or 1 mM H2O2. (I) Quantification of the average number of beta-cells in controls (n = 24) and H2O2-treated larvae (n = 22). H2O2-treatment significantly increased the number of regenerating beta-cells (p = 0,03). Note that a majority of the regenerated beta-cells are H2B-GFP+ and dsRED−. Error bars = SEM. |

ZFIN is incorporating published figure images and captions as part of an ongoing project. Figures from some publications have not yet been curated, or are not available for display because of copyright restrictions. PHENOTYPE:
|
|
ZFIN is incorporating published figure images and captions as part of an ongoing project. Figures from some publications have not yet been curated, or are not available for display because of copyright restrictions. |