
- Title
-
Contributions of 5'HoxA/D regulation to actinodin evolution and the fin-to-limb transition
- Authors
- Lalonde, R.L., Akimenko, M.A.
- Source
- Full text @ Int. J. Dev. Biol.
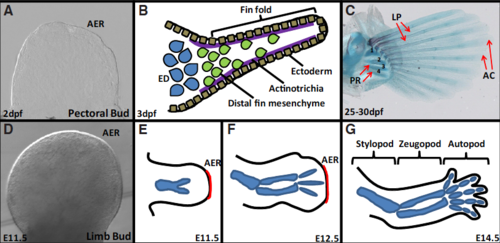
Overview of zebrafish pectoral fin and mouse limb skeletal development. (A-C) Zebrafish pectoral fin development at 2 days post fertilization (dpf), 3dpf and 25-30dpf. (D-G) Mouse forelimb development at E11.5, E12.5 and E14.5. At 2dpf, the zebrafish pectoral fin consists of a bud possessing an apical ectodermal ridge (A). At 3dpf, the fin fold is supported by actinotrichia (purple lines) and distal fin mesenchyme migrates though the fin fold using the actinotrichia as a scaffold (green cells) (B). The proximal mesenchyme condenses and chondrifies to form the endoskeletal disc (blue cells) (B). At 25-30dpf, the proximal radials are still composed of cartilage (numbered 1-4), and the lepidotrichia have started calcifying. Actinotrichia are restricted to the distal tip of each fin ray (C). The mouse forelimb starts with the formation of a bud very similar to the pectoral fin bud (D). From E11.5 to E.14.5 cartilaginous templates will form for the three limb segments: stylopod, zeugopod and autopod (E-G). The AER regresses after E12.5 in the mouse forelimb (F,G). AC, actinotrichia; AER, apical ectodermal ridge; ED, endoskeletal disc; LP, lepidotrichia; PR, proximal radials.
|
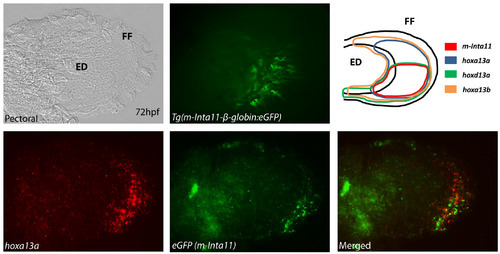
The“m-Inta11” regulatory element is active in a subpopulation of hoxd13a- and hoxa13a-expressing cells in the zebrafish pectoral fin at 72hpf. (A, D-F) Double fluorescent ISH for hoxa13a, eGFP, and (B) Tg(m-Inta11:eGFP) reporter activity in 72hpf pectoral fin. (C) Summary of expression patterns for hoxa13a, hoxd13a,hoxa13b and m-Inta11 activity in 72hpf pectoral fin. The “m-Inta11” regulatory element drives expression in the posterior fin fold mesenchyme (red arrow): eGFP fluoresence (B) and eGFP transcripts are presented (E). The expression of hoxa13a extends to the anterior fin fold mesenchyme (white arrow) (D,F), outside the region where “m-Inta11” is active (red arrow) (E,F). The expression of hoxd13a is posteriorly restricted and partially mimics “m-Inta11” activity (C). The “m-Inta11” element is not active in the proximal-posterior endoskeletal disc and fin fold regions where hoxd13a, and hoxa13b are co-expressed (purple arrow) (C). Brightfield (A), fluorescent (B,D,E) and merged (F) images are present. ED, endoskeletal disc; FF, fin fold. Scale bar, 3 mm. |
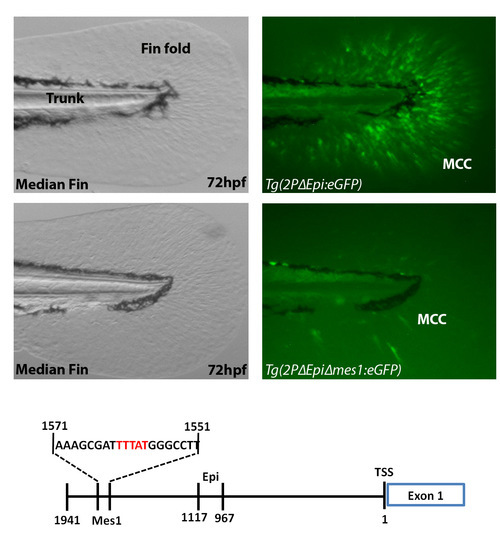
Enhancer activity of 2PΔEpi drastically reduced when putative binding site for Hox (mes1 site) removed. (A-D) Zebrafish median fins at 72hpf comparing eGFP reporter expression when driven by either 2PΔEpi or 2PΔEpiΔmes1 regulatory elements. (E) Schematic of actinodin1 1941bp region of the first non-coding exon. The 2PΔEpi regulatory element is able to drive reporter expression in the migrating mesenchymal cells of the median and pectoral fin folds (Median fin: A-B, Pectoral fin: Fig. 5B). Reporter expression is drastically reduced in the median fin when mes1 site is removed from the 2PΔEpi regulatory element (C-D). No eGFP-positive cells are visible in the pectoral fin (data not shown). Mes1 site consists of a 20bp region containing the consensus Hox binding domain TTTAT (Red text) (E). 2PΔEpi regulatory contains the entire 1941bp fragment with Epi region removed (E). Two independent lines were obtained to confirmed the expression pattern of Tg(2PΔEpiΔmes1:eGFP). Brightfield (A,C) and fluorescent (B,D) images are displayed. MMC, migrating mesenchymal cells; TSS, transcription start site. |

The “m-Inta11” and “2PΔEpi” enhancer elements display overlapping domains of activity in the zebrafish pectoral fin fold mesenchyme at 72hpf. (A-D) Zebrafish pectoral fin at 72hpf of Tg(2PΔEpi:mCherry) x Tg(m-Inta11:eGFP) double transgenic fish. Both regulatory elements drive overlapping reporter expression in posterior fin fold mesenchyme (yellow arrow) (B-D), providing evidence they may both be co-activated by Hoxa13a and Hoxd13a proteins. Note the absence of reporter activity in anterior fin fold mesenchyme (B-D). Due to inconsistencies within transgenic lines, individual cells contain variable amounts of eGFP and mCherry protein and accounts for the colour variation observed in different mesenchymal cells (D). Brightfield (A), Fluorescent (B, C), and merged (D) images are displayed. ED, endoskeletal disc; FF, fin fold. Scale bar, 3 mm. |