
- Title
-
Heart enhancers with deeply conserved regulatory activity are established early in zebrafish development
- Authors
- Yuan, X., Song, M., Devine, P., Bruneau, B.G., Scott, I.C., Wilson, M.D.
- Source
- Full text @ Nat. Commun.

Mouse Smarcd3-F6 enhancer labels early cardiac progenitors in zebrafish. a Generation of Tg(Smarcd3-F6:EGFP) zebrafish line b In-situ hybridization against gfp transcripts on Tg(Smarcd3-F6:EGFP) transgenic embryos. Smarcd3-F6 enhancer marks lateral margins (arrowheads) during gastrulation and ALPM regions (arrows) after gastrulation. c Native GFP expression in Tg(Smarcd3-F6:EGFP) embryos at 10 hpf. Embryos are shown in lateral views. d Immunostaining of GFP and ZsYellow on Tg(Smarcd3-F6:EGFP) and Tg(nkx2.5:ZsYellow) double transgenic embryos. Cells expressing ZsYellow were marked by GFP as well. e Workflow of mRNA-seq and ATAC-seq experiments. f Volcano plot showing genes differentially expressed between Smarcd3-F6:GFP+ and Smarcd3-F6:GFP- populations (FDR < 0.05, absolute log2FC > 1). g Top 10 most enriched GO terms obtained from genes that were significantly more highly expressed in Smarcd3-F6:GFP+ or Smarcd3-F6:GFP- populations. All scale bars represent 100 μm EXPRESSION / LABELING:
|
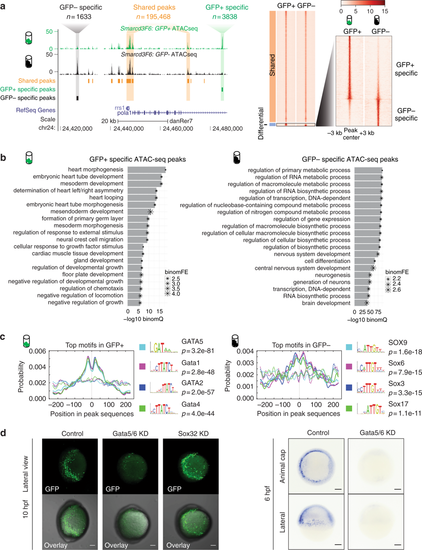
Open chromatin landscape of Smarcd3-F6 labeled population. a Genome browser view and heatmap showing ATAC-seq peaks shared between GFP+ and GFP− populations or enriched in one population. In the heatmap, read intensity for regions within 3 kb of the peak center was plotted for each peak. b Barplot showing the 20 most enriched GO biological function terms obtained from GFP+ /− specific peaks using GREAT analysis. c Probabilities of the top 4 enriched motifs within the GFP+ /− specific peaks calculated by CentriMo76. Each curve shows the probability of the best match to a given motif occurring at a given position in the input sequences. Solid lines represent probabilities calculated from query peak sets (GFP+ /− specific peaks) while dash lines show that from the background sequences (shared peaks). d (Left) Confocal images of native GFP expression in control (uninjected), Gata5/6 KD (injected with Gata5/6 morpholinos) and Sox32 KD (injected with CAS morpholino) Tg(Smarcd3-F6: EGFP) transgenic embryos at 10 hpf; (Right) gfp in-situ on Tg(Smarcd3-F6: EGFP) embryos of 6 hpf that were uninjected (control) or injected with Gata5/6 morpholinos. All staining and imaging were performed under the same condition for the control and KD groups. All scale bars represent 100 μm |

Identification and in vivo characterization of accessible conserved non-coding elements (aCNEs). a Barplot showing the percentage of conserved regions in all GFP+ /− specific and shared ATAC-seq categories. Solid lines in the cartoon indicate direct sequence alignment and dotted lines showcases of indirect alignment bridged by intermediate species or ancestry reconstruction. b Barplot showing the aCNEs/sequenced conserved (seqCon) percentage. Most seqCon open chromatin regions were identified as having shared orthologous accessible chromatin. c Strategy for identifying and characterizing GFP+ specific aCNEs in zebrafish. Stable transgenic lines for 18 aCNEs were characterized. d Cartoon showing the zebrafish heart anatomy at 48 hpf (left panel). Heart expression patterns observed in ZaCNEs transgenic lines were classified into 4 categories (right panel), including I: broad expression in the whole heart; II: ventricle-enriched expression; III: atrioventricular (AVC)-enriched expression; IV: outflow tract (OFT)-enriched expression. One representative example of each category was shown and the numbers of ZaCNEs fall in each category are indicated in the brackets. The two closest genes near each ZaCNEs are indicated. All images were taken from the ventral view and all scale bars represent 100 μm |

Anciently conserved open chromatin regions share conserved cardiac activities. Fluorescent images (a, b) of aCNE transgenic lines generated using zebrafish or human sequences. In-situ characterization (c, d) of the activities of the zebrafish (upper panel) and human (middle panel) aCNE sequences and the endogenous expression of zebrafish cardiac genes (lower panel) nearby. In 48 hpf images in (c), black triangles indicate staining in ventricles and red triangles staining in the inner curvature of atria for both aCNE1 transgenic lines. In 48 hpf images in (d), stars indicate the conserved activity of both aCNE20 enhancers at the inner curvature of ventricles and atrioventricular canal regions and red triangles point to the staining in inflow tract. All images shown were collected from embryos of stable lines and all scale bars represent 100 μm |

ZFIN is incorporating published figure images and captions as part of an ongoing project. Figures from some publications have not yet been curated, or are not available for display because of copyright restrictions. |
|
ZFIN is incorporating published figure images and captions as part of an ongoing project. Figures from some publications have not yet been curated, or are not available for display because of copyright restrictions. EXPRESSION / LABELING:
|
|
Unillustrated author statements |