
- Title
-
Simplet-dependent regulation of β-catenin signaling influences skeletal patterning downstream of Cx43
- Authors
- Bhattacharya, S., Gargiulo, D., Iovine, M.K.
- Source
- Full text @ Development
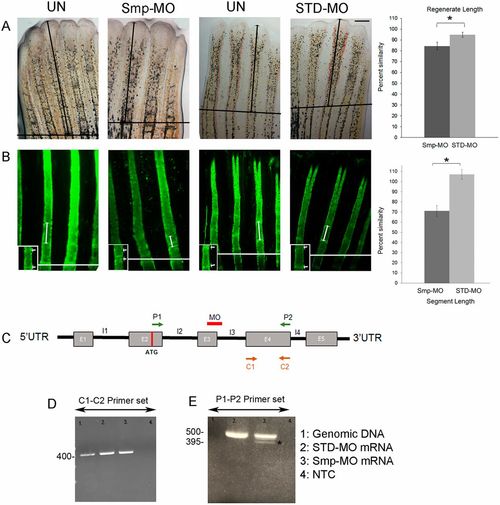
The Smp-KD phenotypes include significantly reduced segment length and regenerate length. (A) Regenerate length is reduced in Smp-MO-treated fins compared with STD-MO-treated fins. All fins were amputated at the 50% level. The amputation plane is indicated (black line). The black arrow indicates the distance from the amputation plane to the distal tip of the 3rd fin ray. Graph shows significant reduction in percentage similarity in Smp-MO- and STD-MO-injected fins (*P<0.05, Student's t-test, two-tailed and unpaired). Three independent trials were performed (n=25 total per treatment). The data did not differ significantly from normality (Shapiro-Wilk's test, P>0.05). Error bars represent s.e.m. (B) Calcein-stained fin rays show reduced segment length in Smp-MO-treated fins compared with STD-MO-treated fins. Double-headed arrows indicate the first completed segment following the amputation plane (white line). The inset shows a higher magnification of the segments (arrows indicate joints). Graph reveals significant reduction in percentage similarity in Smp-MO- and STD-MO-injected fins (*P<0.05, Student's t-test, two-tailed and unpaired). Three independent trials were performed (n=25 total per treatment). The data did not differ significantly from normality (Shapiro-Wilk's test, P>0.05). Error bars represent s.e.m. (C) Schematic representation of zebrafish smp pre-mRNA. The exons are shown in gray boxes and the introns are drawn as black lines. Positions of the MO and of the primers are indicated. The MO is predicted to cause skipping of exon 3 (55 bp). (D) Results of the RT-PCR analysis using C1-C2 primer set (396 bp product is predicted). (E) Results of the RT-PCR analysis using P1-P2 primer set reveals reduced full-length product and Smp-MO-dependent presence of the shorter product. The P1-P2 primer pair amplified product (380 bp) in lane 3 marked with an asterisk is caused by the skipping of exon 3 compared with lane 2, where exon 3 was included (435 bp). Scale bar: 50 μm. PHENOTYPE:
|
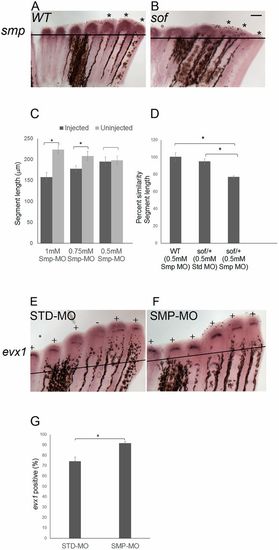
smp and cx43 function in a common pathway to influence evx1 expression. (A) Wild-type and (B) sofb123 fins were amputated at 50% and permitted to regenerate for 87 h. At 87 hpa, the fins were harvested and processed for smp whole-mount in situ hybridization. Asterisks represent the expression domains of smp in each of the three fin rays. Three independent trials were performed (n=18 per genotype). (C) Smp-MO concentrations of 1 mM (n=6), 0.75 mM (n=6) and 0.5 mM (n=11) were used to identify the subthreshold concentration. The 0.5 mM concentration of Smp-MO was selected as the subthreshold dose, as there is no significant decrease in the segment length. The data did not differ significantly from normality (Shapiro-Wilk's test, P>0.05). Error bars represent s.e.m. Student's t-test was performed to test for significance (two-tailed and unpaired, *P<0.05). (D) Synergistic effects of the 0.5 mM dose of Smp-MO with sofb123 heterozygotes (n=10) are revealed compared with either wild-type fins (n=11) injected with 0.5 mM Smp-MO or with sofb123/+ heterozygotes injected with STD-MO (n=7). The data do not differ significantly from normality (Shapiro-Wilk's test, P>0.05). Error bars represent s.e.m. Student's t-test was performed to test for significance (two-tailed and unpaired, *P<0.05). (E,F) Whole-mount in situ hybridization shows that the frequency of evx1 expression is increased in Smp-MO fins (n=21 fins) compared with the STD-MO fins (n=22 fins) (three biological replicates). All fin rays across the fins were injected with Smp-MO or STD-MO at 72 hpa and harvested at 87 hpa. Plus indicates fin rays positive for evx1; minus indicates fin rays negative for evx1. (G) The Smp-MO fins show an increased frequency of evx1-positive fin rays compared with STD-MO injected fins. The data did not differ significantly from normality (Shapiro-Wilk's test, P>0.05). Error bars represent s.e.m. Student's t-test was performed to test for significance (two-tailed and unpaired, *P<0.05). Scale bar: 50 μm. |
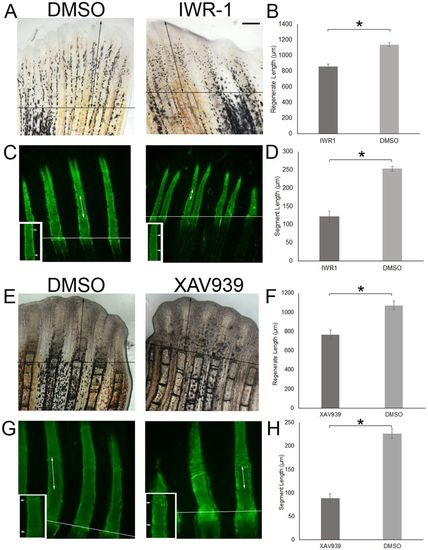
β-Catenin regulates regenerate length and segment length. (A,B,E,F) Wild-type fish at 72 hpa were treated with IWR-1 (10 µM) compared with DMSO for 3 days (n=13 per treatment) or with XAV939 (5 µM) compared with DMSO for 3 days (n=16 per treatment). The same fins were used to measure regenerate length and segment length. Regenerate length was reduced in drug-treated fins compared with DMSO-treated fins. (C,D,G,H) Segment length was reduced in drug-treated fins compared with DMSO-treated fins. The amputation plane is identified by the horizontal line, and the double-headed arrows identify regenerate length in the top panels and segment length in the bottom panels. Insets in C and G show the measured segment at a higher magnification (arrowheads indicate joints). There is a significant reduction in regenerate length (B,F) and segment length (D,H). The data in B,D,F,H do not differ significantly from normality (Shapiro-Wilk's test, P>0.05). Error bars represent s.e.m. Student's t-test was performed to test for significance (two-tailed and unpaired, *P<0.05). Scale bar: 50 μm. PHENOTYPE:
|

ZFIN is incorporating published figure images and captions as part of an ongoing project. Figures from some publications have not yet been curated, or are not available for display because of copyright restrictions. |
|
ZFIN is incorporating published figure images and captions as part of an ongoing project. Figures from some publications have not yet been curated, or are not available for display because of copyright restrictions. PHENOTYPE:
|