
- Title
-
Effective CRISPR/Cas9-based nucleotide editing in zebrafish to model human genetic cardiovascular disorders
- Authors
- Tessadori, F., Roessler, H.I., Savelberg, S.M.C., Chocron, S., Kamel, S.M., Duran, K.J., van Haelst, M.M., van Haaften, G., Bakkers, J.
- Source
- Full text @ Dis. Model. Mech.
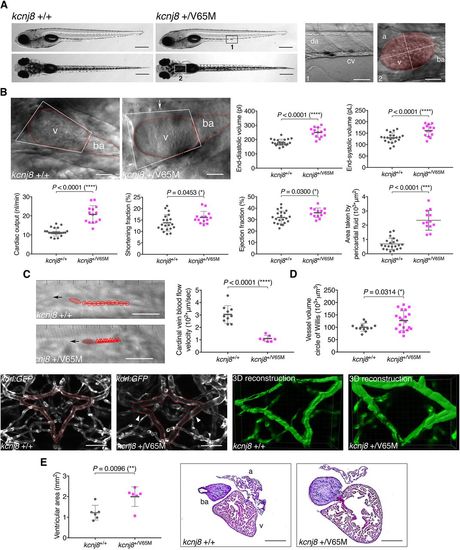
Heterozygous kcnj8+/V65M mutation induces CS-related cardiac anomalies and cerebral vasodilation in zebrafish. (A) Representative images illustrating the morphology of 5 dpf wild-type and kcnj8+/V65M mutants as seen from a left lateral (top) and dorsal (bottom) view. Boxes designate imaged areas that were used to assess cardiac function: the cardinal vein (1) and the heart (2). The ventricular area of the heart is highlighted, with the long axis and short axis of the ventricle indicated by dashed lines. a, atrium; ba, bulbous ateriosus; cv, cardinal vein; da, dorsal aorta; v, ventricle. (B) Quantification of cardiac function using individual characteristic confocal sections from a time series of the embryonic cardiac cycle at 5 dpf. Pericardial edema was quantified by measuring pericardial area using striking morphological landmarks, indicated by white boxes. Ventricular area was subtracted. Arrows show accumulation of fluid in kcnj8+/V65M mutants. Dotted red lines indicate ventricle (v) and bulbous arteriosus (ba). (C) Tracking of individual red blood cells (RBCs) measuring blood flow velocity in the cardinal vein. RBCs were tracked for ten frames using ImageJ (NIH) and the plugin MTrackJ (Meijering et al., 2012). One representative image of each genotype is shown. Black arrow indicates the direction of RBC movement. (D) Quantification of vascular dilations in a Tg(kdrl:GFP) background. Representative confocal images of the circular structure comprising the BCA and PCS in wild-type and heterozygous 5 dpf fish are outlined in red. The arrowheads indicate distinct regions of vasodilation. 3D reconstruction of vascular structure in Imaris was used to calculate vessel volume. (E) Ventricular area in heterozygous kcnj8+/V65M mutants. Representative heart histology of adult kcnj8+/V65M mutants and respective wild-type siblings after H&E staining. Exemplary depiction of one WT and one kcnj8+/V65M heart. For assessment of ventricular chamber size, tissue sections showing the largest ventricular area were selected and area was quantified using ImageJ (NIH). For all graphs, significance was determined by two-tailed unpaired Student's t-test or Mann–Whitney two-tailed U-test: *P≤0.05; **P≤0.01; ***P≤0.001; ****P≤0.0001. The black horizontal bar indicates the mean value for each condition. Sample sizes: (B) kcnj8+/+, n=21; kcnj8+/V65M, n=14; (C) kcnj8+/+, n=10; kcnj8+/V65M, n=7; (D) kcnj8+/+, n=12; kcnj8+/V65M, n=20; (E) kcnj8+/+, n=6; kcnj8+/V65M, n=6. Scale bars: (A) 1 mm (top and middle) and 50 µm (bottom); (B) 50 µm; (C) 10 μm; (D) 50 µm; (E) 500 µm. All embryos analyzed originated from group matings of adult zebrafish. |

Homozygous kcnj8V65M/V65M mutation induces CS-related cardiac anomalies and cerebral vasodilation in zebrafish embryos. (A) Representative images illustrating the morphology of 5 dpf wild-type and kcnj8V65M/V65M mutants as seen from a left lateral (top) and dorsal view (bottom). (B) Quantification of cardiac function using individual characteristic confocal sections from a time series of the embryonic cardiac cycle at 5 dpf. Pericardial edema was quantified by measuring pericardial area using striking morphological landmarks indicated by white boxes. (C) Tracking of individual red blood cells (RBCs) measuring blood flow velocity in the cardinal vein. RBCs were tracked for 10 frames using ImageJ (NIH) and the plugin MTrackJ(35). (D) Quantification of vascular dilations in a Tg(kdrl:GFP) background. 3D reconstruction of vascular structure in Imaris was used to calculate vessel volume. kcnj8+/+ controls are the same as in Fig.2B-D. For all graphs, significance was determined by two-tailed unpaired Student's t test or Mann–Whitney two-tailed U test: * p≤0.05; ** p≤0.01; *** p≤0.001; **** p≤0.0001. The black horizontal bar indicates the mean value for each condition. Sample size, kcnj8+/+, n=21; kcnj8V65M/V65M, n=19 in B, kcnj8+/+, n=10; kcnj8V65M/V65M, n=10 in C, kcnj8+/+, n=20; kcnj8V65M/V65M, n=11 in D. Scale bars, 1 mm A. All embryos analyzed originated from group matings of adult zebrafish. PHENOTYPE:
|

ZFIN is incorporating published figure images and captions as part of an ongoing project. Figures from some publications have not yet been curated, or are not available for display because of copyright restrictions. PHENOTYPE:
|
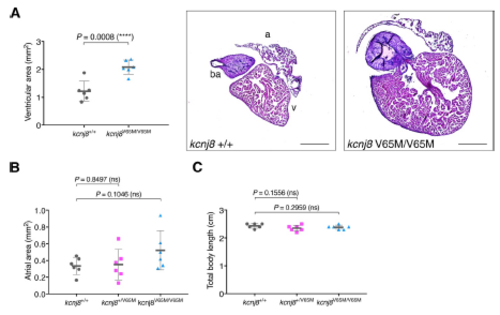
Adult kcnj8[V65M] fish show enlarged ventricular area. (A) Ventricular area in homozygous kcnj8[V65M] mutants. Representative heart histology of adult kcnj8V65M/V65M mutants and wildtype siblings after H&E staining. Exemplary depiction of 1 WT and 1 kcnj8[V65M] heart. For assessment of ventricular chamber size, tissue sections showing the largest ventricular area were selected and area was quantified using ImageJ (NIH). (B) Atrial area in heterozygous and homozygous kcnj8[V65M] mutants. For assessment of atrial chamber size, tissue sections showing the largest atrial area were selected and area was quantified using ImageJ (NIH). (C) Total body length in kcnj8[V65M] mutants. To account for variations in heart size overall body length was measured from the tip of the head to the end of the trunk (before the caudal fin). kcnj8+/+ controls are the same as in Fig.2E. For all graphs, significance was determined by twotailed unpaired Student's t test or Mann–Whitney two-tailed U test: * p≤0.05; ** p≤0.01; *** p≤0.001; **** p≤0.0001. The black horizontal bar indicates the mean value for each condition. Sample size, kcnj8+/+, n=6; kcnj8+/V65M, n=6; kcnj8V65M/V65M, n=6 in A-C. Scale bars, 500 μm in A. All embryos analyzed originated from group matings of adult zebrafish. PHENOTYPE:
|
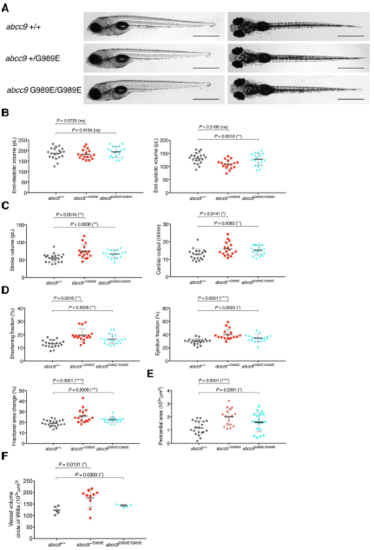
abcc9[G989E] embryos show CS-related anomalous heart function and pericardial edema at 5 dpf. (A) Comparison of wild-type and abcc9[G989E] mutants at 5 dpf seen from a left lateral (left) and dorsal view (right). (B-D) Quantification of cardiac function using sequential still frames from high-speed imaging of the embryonic cardiac cycle at 5 dpf. Ventricular volume (B), cardiac output (C) and contractile function (D) were calculated. (E) Quantification of pericardial edema by measuring pericardial area using striking morphological landmarks. In order to correct for possible enlarged ventricular size in mutants, ventricular area was subtracted. (F) Quantification of vascular dilations in a Tg(kdrl:GFP) background. 3D reconstruction of vascular structure in Imaris was used to calculate vessel volume. For all graphs, significance was determined by two-tailed unpaired Student's t test or Mann–Whitney two-tailed U test: * p≤0.05; ** p≤0.01; *** p≤0.001; **** p≤0.0001. The black horizontal bar indicates the mean value for each condition. Sample size, abcc9+/+, n=20; abcc9+/G989E, n=17; abcc9G989E/G989E, n=19 in B-E; abcc9+/+, n=5; abcc9+/G989E, n=10; abcc9G989E/G989E, n=5 in F. Scale bar, 1 mm in A. All embryos analyzed originated from group matings of adult zebrafish. PHENOTYPE:
|

abcc9[C1043Y] embryos show torturous cerebral vessels at 5 dpf. (A) Comparison of wildtype and abcc9[C1043Y] mutants at 5 dpf seen from a left lateral (left) and dorsal view (right). (B-D) Quantification of cardiac function using sequential still frames from high-speed of the embryonic cardiac cycle at 5 dpf. Ventricular volume (B), cardiac output (C) and contractile function (D) were calculated. (E) Quantification of pericardial edema by measuring pericardial area using striking morphological landmarks. In order to correct for possible enlarged ventricular size in mutants, ventricular area was subtracted. (F) Representative confocal images of circular structure comprised of BCA and PCS in wild type and mutant 5 dpf fish are highlighted in red. (G) Quantification of phenotype shown in (F) in heterozygous, homozygous and wildtype siblings, (H) Quantification of vascular dilations in a Tg(kdrl:GFP) background. 3D reconstruction of vascular structure in Imaris was used to calculate vessel volume. For all graphs, significance was determined by two-tailed unpaired Student's t test: * p≤0.05; ** p≤0.01; *** p≤0.001; **** p≤0.0001. The black horizontal bar indicates the mean value for each condition. Sample size, abcc9+/+, n=20; abcc9+/C1043Y, n=20; abcc9C1043Y/C1043Y, n=11 in B-E; abcc9+/+, n=6; abcc9+/C1043Y, n=12; abcc9C1043Y/C1043Y, n=5 in G-H. Scale bar, 1 mm in A, 50 μm in F. All embryos analyzed originated from group matings of adult zebrafish. |
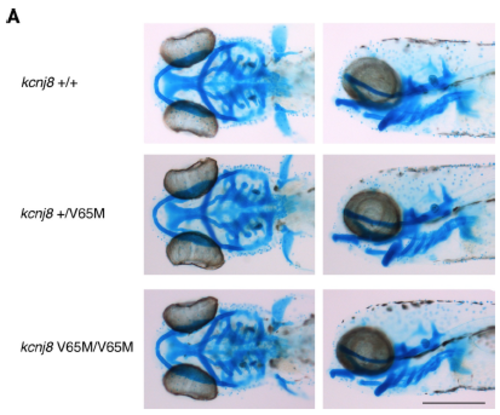
Alcian blue staining in kcnj8[V65M] mutants. (A) Comparison of wild-type and kcnj8[V65M] mutants stained with Alcian blue at 5 dpf seen from a dorsal (left) and left lateral view (right). Sample size, kcnj8+/+, n=5; kcnj8+/V65M, n=12; kcnj8V65M/V65M, n=7 in A. Scale bar, 500 μm in A. All embryos analyzed originated from group matings of adult zebrafish. |