
- Title
-
Seeing is believing: methods to monitor vertebrate autophagy in vivo.
- Authors
- Lopez, A., Fleming, A., Rubinsztein, D.C.
- Source
- Full text @ Open Biol.
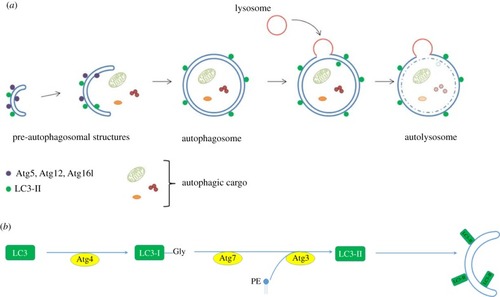
( |

Schematic diagram of conventional methods to measure rates of autophagy. ( |

Schematic diagram of the tandem mRFP-EGFP-LC3 reporter to monitor autophagic flux. ( |

Schematic diagram of the GFP-LC3-RFP-LC3DG reporter to measure autophagic flux. ( |

Measuring autophagy substrate clearance |