
- Title
-
Neuromesodermal progenitors are a conserved source of spinal cord with divergent growth dynamics
- Authors
- Attardi, A., Fulton, T., Florescu, M., Shah, G., Muresan, L., Lenz, M.O., Lancaster, C., Huisken, J., van Oudenaarden, A., Steventon, B.
- Source
- Full text @ Development
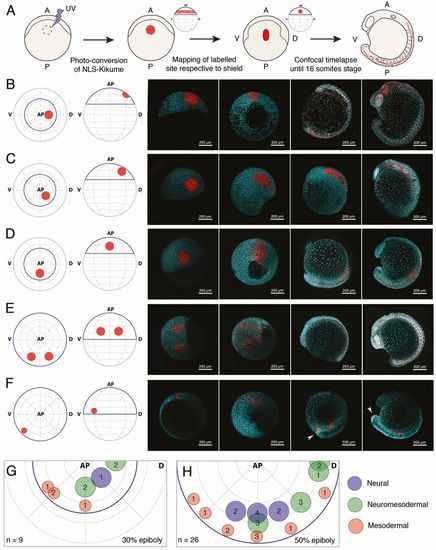
Tissue-level segregation of spinal cord and mesoderm populations occurs by 50% epiboly. (A) Description of large-scale fate-mapping experiments. NLS-Kik-injected embryos are mounted for confocal microscopy at 30 or 50% epiboly, and a circular region of the blastoderm is photoconverted. Time-lapse imaging is carried out until the 16-somite stage. Position of the label is retrospectively assigned based on its location on the anterior-posterior axis (determined at the moment of labelling) and the position of the prospective embryonic shield (appearing right after 50% epiboly), which marks the dorsal side of the embryo. (B-F) Embryos were photolabelled in the territories shown in the animal and lateral view diagrams (left-most image) and cells were followed until the 16-somite stage (right-most image panels) by time-lapse microscopy. Consecutive time points are displayed in the right-hand four panels for each example label. Labels were placed in the prospective anterior neural (B), marginal zone (C) and prospective spinal cord (D) territories at 30% epiboly. At 50% epiboly, the boundaries of the prospective spinal cord region (E) and a smaller, more ventro-marginal, mesodermal region (F) were mapped. Arrowheads in F indicate that a subset of labelled cells specifically migrates and contributes to the tailbud mesenchyme. Native NLS-KikGR is shown in cyan, photoconverted NLS-Kik in red. (G,H) Plots showing the location and diameter of labels in relation to the number of embryos imaged per label at 30% (G) and 50% (H) epiboly. Labels are colour-coded according to the ratio of cells allocated to neural tissues or paraxial mesoderm. Blue indicates that over 90% of labelled cells contribute to neural tissues; red indicates that over 90% of labelled cells contribute to paraxial mesoderm; green indicates that labelled cells contribute both to neural and paraxial mesoderm. n indicates total number of embryos fate mapped. AP, animal pole; V, prospective ventral side; D, prospective dorsal side (shield). Dorsal and ventral only indicate 3D orientation of the embryo and not future dorsoventral position of cells. |
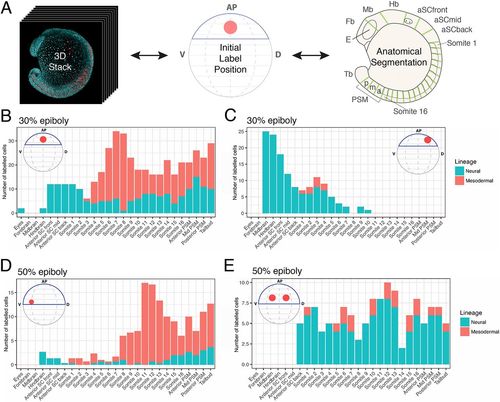
Axial dispersion and neuro-mesodermal contribution of labelled cells. (A) 3D confocal stacks of photolabelled embryos were analysed to relate the initial label position with the contribution of cells along the anterior-posterior axis. (B-E) The contributions of labelled populations from individual examples are plotted against the anterior-posterior axis with the number of cells in each tissue compartment shown in red for the somitic mesoderm or blue for the neural tube. There is a significant degree of overlap between spinal cord- and mesoderm-fated cells within the marginal zone at both 30% (B,C) and 50% (D,E) epiboly. |
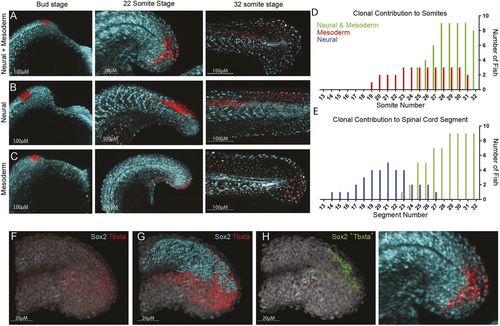
Tailbud neuromesodermal populations are restricted to the posterior-most aspect of the body axis. (A-C) Regions of the tailbud were photolabelled at bud stage and followed until the completion of somitogenesis. Populations on the dorsolateral wall of the tailbud gave rise to both spinal cord and mesoderm derivatives (A), those more anterior generated only spinal cord (B) and those more ventral gave rise to only mesoderm (C). All labels had an additional contribution to non-neural ectoderm. (D) The contribution of labelled populations to the anterior-posterior axis are plotted separately for mesodermal (D) and neural (E) fates. In red are labels with mesodermal contribution only (n=7), in blue are spinal cord-specific populations (n=5) and in green are those that gave rise to both germ layers (n=9). (F-I) Hybridization chain reaction (HCR) for sox2 and tbxta was used to locate double-positive cells within 3D confocal datasets. (F) Original dataset with sox2 in cyan and tbxta in red; DAPI is in grey. (G) Surface segmentation of the HCR stain was performed to mask sox2 expression within the tbxta channel. (H) Masking reveals only those cells that are co-expressing both genes. (I) Magnified image of that shown in A to compare photolabel with co-expressing cells. |
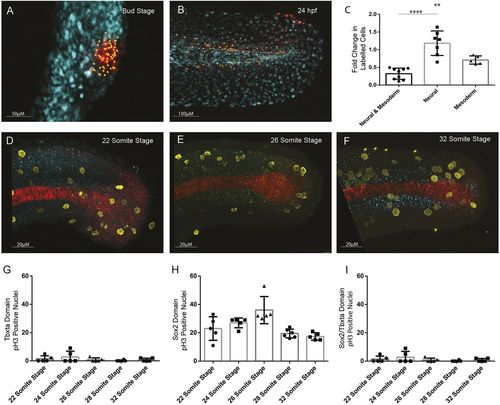
Quantification of cell division in tailbud NMps. Quantification of increase in number of cells photolabelled using nls-kikume from (A) bud stage through to (B) 24 hpf. (C) Fold-change increase in labelled clone number changes depending on the labelled progenitor type, with regions contributing only to neural tissue undergoing most clonal expansion and bipotent progenitors undergoing the least clonal expansion. (D-F) Replicating cells stained using phospho-histone H3 (pH3) as a marker of mitotic cells (yellow) with bipotent NMps identified through co-expression of Sox2 (blue) and Ntl (red) at the (D) 22-somite stage, (E) 26-somite stage and (F) 32-somite stage. (G-I) The frequency of Ph3-positive nuclei in the (G) Ntl-positive expression domain, including notochord, (H) Sox2-positive expression domain, and (I) Ntl and Sox2-positive NMp domain. Two-tailed Student's t-test. **P<0.01, ****P<0.0001. |
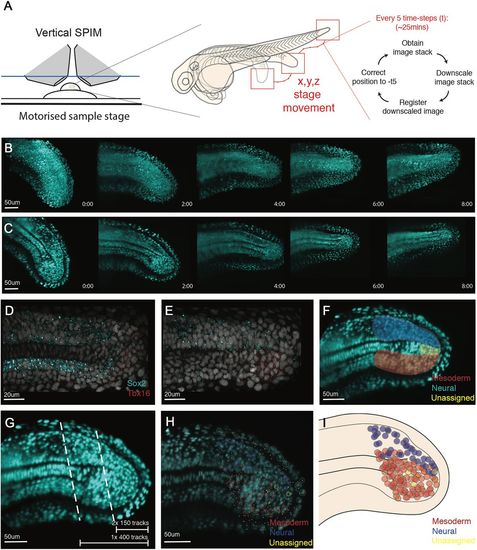
Single cell tracking of tailbud progenitors during late somitogenesis demonstrates an absence of bi-fated cells and cellular mixing within the tailbud. (A) Experimental design to allow long-term light-sheet imaging of the growing zebrafish tailbud. Embryos at the 21-somite stage were mounted as described by Hirsinger and Steventon (2017). Z-stacks were captured every 2.5 min with image-based registration on downsampled images conducted every five frames. The shift of this registration is then fed back into the stage position in all three directions to re-centre the tailbud within the image. (B,C) Individual frames are shown every 2 h across the 8 h movie shown as both maximum projections (B) and as a medial slice (C). (D-G) Fates of cells were assigned by the termination point of the track by scoring-based position within the anatomy of the tailbud and the associated expression of neural markers (Sox2) and mesdoermal markers (Tbx16 and Tbxta). Medial slices of hybridization chain reaction are shown in D and E, and used to zone the tailbud in F. Automatic tracks were selected using a custom MATLAB script by selecting all cells posteriorly to the lines shown in G. Two movies were subsetted using the most-posterior lines generating two movies of 150 tracks each. A third movie was subset using the more-anterior line, generating 400 tracks. (H,I) Final fates were assigned and have been overlaid over the starting timepoint (H) with open circles representing cells close to the viewed plane and dots representing cells on a different z-section. These different z-planes have been collapsed into a single 2D image (I) and demonstrate an absence of a mixed population of unfated cells. The mixing around the notochord is an artifact of collapsing the z-axis into a 2D image. No cells were observed dividing with progeny entering both lineages. |