
- Title
-
Left/right asymmetric collective migration of parapineal cells is mediated by focal FGF signaling activity in leading cells
- Authors
- Roussigné, M., Wei, L., Tsingos, E., Kuchling, F., Alkobtawi, M., Tsalavouta, M., Wittbrodt, J., Carl, M., Blader, P., Wilson, S.W.
- Source
- Full text @ Proc. Natl. Acad. Sci. USA

The Tg(dusp6:d2EGFP) FGF pathway reporter is focally activated in the parapineal by Fgf8. (A–B′) Confocal sections showing expression of Tg(dusp6:d2EGFP) (green) in the epithalami of 28-hpf (A) or 32-hpf (B) embryos with cell nuclei labeled (Topro-3, gray) visualizing the epiphysis (white circle) and parapineal (yellow circle). White boxes in A and B are magnified in A′ and B′. (C–D′) Confocal maximum projections (C and D) or sections (C′ and D′) of the epithalami of 35-hpf Tg(dusp6:d2EGFP) embryos treated with DMSO (C and C′) or SU5402 (D and D′) immunostained for GFP (green) and additionally for nuclei (C′ and D′; gray). In the control embryos (C and C′; n = 10), Tg(dusp6:d2EGFP) is expressed in both the epiphysis and the parapineal; in the SU5402 treated embryos (D and D′; n = 11), Tg(dusp6:d2EGFP) is absent in the parapineal. (E) Image of a 32-hpf parapineal defining eight 45 °C semiquadrants (1–8) along the antero-posterior and LR axes relative to the mean position of the parapineal (center). (F and G) Polar graphs showing the distribution and mean number of total (G, gray) or Tg(dusp6:d2EGFP)+ (F and G, green) parapineal cells in each 45 °C semiquadrant relative to the parapineal mean position (center) at 32 hpf; the distribution of total (gray) and Tg(dusp6:d2EGFP)+ cells (green) are shown at the same scale in G. The radial axis (vertical scale on the left side of polar graphs) represents the mean number of cells per semiquadrant (n = 27 embryos). (H–K″) Confocal sections showing the expression of Tg(dusp6:d2EGFP) (green) and sox1a (red) at 32 hpf in control embryos (H–H″; n = 34) and in three illustrative fgf8−/− mutant embryos (I–K″) displaying no expression (I and I′) weakly and barely lateralized expression (J–J″) or relatively normally patterned (K and K″). The distribution and mean number of Tg(dusp6:d2EGFP)- and sox1a-expressing cells are quantified in SI Appendix, Fig. S2. In all panels (A–D′ and H–K″), embryo view is dorsal, anterior is up. (Scale bars, 10 µm.) |
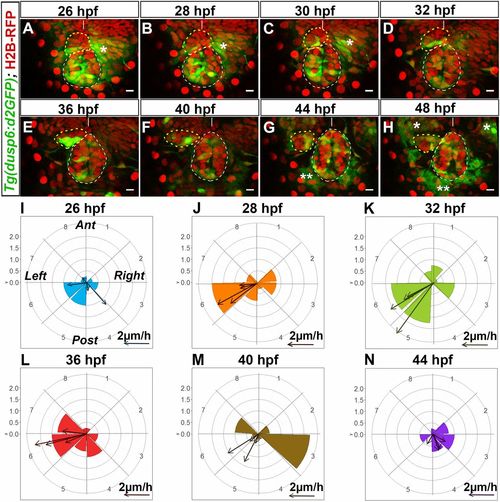
Tg(dusp6:d2EGFP) expression is enriched in cells at the leading edge of the migrating parapineal. (A–H) Time series of thin confocal maximum projection (3 µm) of the brain of a live Tg(dusp6:d2EGFP)pt6 (green) embryo (embryo no. 1 shown in Movie S1) expressing H2B-RFP protein (red) in cell nuclei at different stages of development (26, 28, 30, 32, 36, 40, 44, 48 hpf). The epiphysis and the parapineal are shown as white or yellow dotted circles. Tg(dusp6:d2EGFP) is also expressed in the presumptive habenulae, shown by an asterisk (*); two asterisks (**) indicate autofluorescence that appears from 44 hpf. Embryo view is dorsal, anterior is up. (Scale bars, 10 µm.) Position of Tg(dusp6:d2EGFP)+ cells relative to the mean position of all parapineal cells at different stages of parapineal migration are shown in SI Appendix, Fig. S3I. (I–N) Polar graph showing the distribution of Tg(dusp6:d2EGFP) cells per 45 °C semiquadrant (1–8) relative to the parapineal mean position (center) and the antero-posterior line at a given time point: 26 hpf (I), 28 hpf (J), 32 hpf (K), 36 hpf (L), 40 hpf (M), and 44 hpf (N). The radial axis (0–2, vertical scale, upper left) represents the mean number of Tg(dusp6:d2EGFP)+ parapineal cells per semiquadrant and per embryo (n = 4). At each specific time point, arrows show the orientation of migration for each of the four embryos [defined by the extrapolated line passing through the parapineal mean positions at T and at T + 2 h (for 26 hpf) or T + 4 h (28, 32, 36, 40, 44 hpf)]. The length of the arrow is proportional to the extrapolated distance migrated per hour. Anterior (Ant), posterior (Post), left and right orientations are shown in the I graph. |

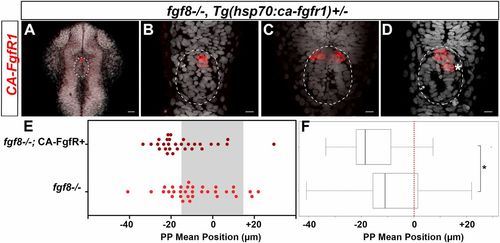
FgfR1 receptor activation partially restores parapineal migration in fgf8−/− mutants. (A–D) Confocal maximum projection (10 µm) showing gfi1ab expression (red) and cell nuclei (gray) in representative control embryos (A and B) and fgf8−/− mutants (C and D) that express CA-FgfR1 (B and D) or not (A and C); embryo view is dorsal, anterior is up. (Scale bars, 10 µm.) Control embryos are siblings of fgf8−/− mutants and thus correspond to both wild-type or fgf8+/− heterozygotes. gfi1ab expression marks the parapineal (yellow circle) while cell nuclei staining allows us to define the epiphysis (white circle) and the brain midline (straight dotted white line). (E) Dot plot showing, for each embryo, the mean parapineal position in micrometers distant to the brain midline (x = 0), at 52 hpf, in control embryos (Con, blue dots) and in fgf8−/− mutant embryos (fgf8−/−, red dots) that expressed (CA-FgfR+, dark color) or not (light color) CA-FgfR1 after a heat shock at 26 and 29 hpf; “NoHS_fgf8−/−;CA-FgfR+” and “NoHS_fgf8−/−” correspond to fgf8−/− mutants that do or do not carry the Tg(hsp70:ca-fgfr1) transgene but were not heat-shocked (dark and light yellow dots, respectively). Gray-shaded zone (−15 µm and +15 µm) define the “no migration” domain as corresponding to the average width of the epiphysis; gray dotted lines show −25 µm and +25 µm. (F) Boxplot showing the distribution of parapineal mean position relative to the brain midline (reference 0, red dotted line) in the same embryos. Parapineal mean position is shifted toward the midline in wild-type embryos expressing CA-FgfR1 (dark blue in E; n = 16) compared with control embryos that do not express CA-FgfR1 (light blue in E; n = 17); P = 0.023 (Wilcoxon test). The expression of CA-FgfR1 partially restores parapineal migration in fgf8−/− mutants (dark vs. light red in E; n = 32); P = 0.039. Parapineal mean position did not differ significantly between fgf8−/− mutants that do or do not carry the Tg(hsp70:ca-fgfr1) transgene but were not heat-shocked (dark versus light yellow in E; n = 26); P = 1 (see pairwise Wilcoxon test in SI Appendix, Table S1). Statistical significance is indicated in F, *P < 0.05, **P < 0.01. |

Global overexpression of CA-FgfR1 in fgf8−/− mutants rescues focal left-sided expression of Tg(dusp6:d2EGFP). (A–D″) Confocal maximum projection (55 µm) showing the whole head (A–D) or confocal sections (A′–D″) showing the epithalamus of 32-hpf Tg(dusp6:d2EGFP) control embryos (A–B″) or Tg(dusp6:d2EGFP) fgf8−/− mutants (C–D″) that express (B–B″ and D–D″) or not (A–A″ and C–C″) Tg(hsp70:ca-fgfr1) transgene after heat shock at 26 and 29 hpf. (Scale bars, 25 µm in A–D and 10 µm in A′–D″.) The image in A″–D″ corresponds to the image in A′–D′ (green) superimposed on nuclear staining (gray) allowing visualization of the epiphysis (white circle) and parapineal (yellow circle); embryo view is dorsal, anterior is up. (E–H′) Polar graphs showing the distribution and mean number of total (E′–H′) or Tg(dusp6:d2EGFP)+ (E–H) parapineal cells in each 45 °C semiquadrant (1–8) relative to the parapineal mean position (center) at 32 hpf. Cell distribution and mean number are shown for control embryos that express (F and F′; n = 11) or not (E and E′; n = 10) CA-FgfR1 transgene and for fgf8−/− mutants that express (H and H′; n = 16) or not (G and G′; n = 12) CA-FgfR1. Radial axis (vertical scale on the left side) represent the mean number of Tg(dusp6:d2EGFP)+ parapineal cells (green area in E–H, scale 0–2) or all parapineal cells (gray area in E′–H′, scale 0–3) per semiquadrant and per embryo. The expression of Tg(dusp6:d2EGFP) is increased in the parapineal of embryos expressing CA-FgfR1 although it is still mosaic and enriched on the left/posterior side (B–B″ and F; n = 11) as in controls (A–A″ and E; n = 10). In fgf8−/− embryos, Tg(dusp6:d2EGFP) is either not expressed in the parapineal or weakly detected (C–C″ and G; n = 12) while its expression is rescued in the parapineal of fgf8−/− embryos expressing CA-FgfR1 transgene (D–D″ and H; n = 16). |
Focal activation of FGF signaling in few parapineal cells partially restores parapineal migration in fgf8−/− mutants. (A–D) Confocal 40-µm maximum projection and confocal thin 2-µm projections (B–D) showing the expression of the ca-fgfr1 transgene by in situ hybridization (red) in four different representative fgf8−/−; Tg(hsp70:ca-fgfr1)+/− embryos, 1–2 h after two cells were irradiated in the anterior epiphysis. (Scale bars, 25 µm in A and 10 µm in B–D.) Superimposed nuclear staining (Topro-3, gray) visualizes the pineal complex (white circle) consisting of both the pineal and the parapineal at this stage (26–28 hpf). ca-fgfr1 mRNA is only detected in the anterior pineal complex, in three cells (A and B) or six cells (C and D), the average number being 6 CA-FgfR1–expressing cells (n = 10 embryos). Given their location in the anterior pineal complex, most of these CA-FgfR1–expressing cells are expected to become parapineal cells; some more posterior cells (*) might become epiphyseal cells; embryo view is dorsal, anterior is up. (E) Dot plot showing, for each embryo, the mean parapineal position in micrometers distant to the brain midline (x = 0), at 52 hpf, in fgf8−/− mutants that were locally heat-shocked (two to three irridiated cells) between 25 and 29 hpf; gray-shaded zone (–15 µm and +15 µm) defines the average width of the epiphysis. Parapineal mean position in fgf8−/− mutant embryos carrying the Tg(hsp70:ca-fgfr1) transgene is slightly shifted toward the left (dark red dots, n = 30) compared with fgf8−/− mutants that do not express CA-FgfR1 (light red dots, n = 33). (F) Boxplot showing the distribution of parapineal mean position relative to the brain midline (reference 0) in same embryos. Local expression of CA-FgfR1 in few parapineal cells partially rescues parapineal migration (P = 0.02; Wilcoxon test; *indicates statistical significance in F). |

Left biased lateralization of FGF pathway activation depends on lateralized Nodal signaling. (A–F) Confocal sections of the pineal complex at 30 hpf showing the expression of Tg(dusp6:d2EGFP) (green) in two illustrative control embryos (A and B; n = 36) and in two embryos injected with no tail morpholinos (ntl MO) (C and D; n = 37) or southpaw morpholinos (spaw MO) (E and F; n = 38); the superimposed nuclear staining (gray) allows visualization of the epiphysis (white circle) and parapineal (yellow circle). Embryo view is dorsal, anterior is up. (Scale bars, 10 µm.) (G–I′) Polar graphs showing the distribution and mean number of total (gray) or Tg(dusp6:d2EGFP)+ (green) parapineal cells in each 45 °C hemiquadrant relative to the parapineal mean position (graph center) at 30 hpf in control embryos (G–G″, n = 36), ntl morphants (H–H″; n = 37), or spaw morphants (I–I″; n = 38). For each context, cell distributions and mean numbers of cells are averaged within embryos that display an AI (see Materials and Methods and SI Appendix) in Tg(dusp6:d2EGFP) expression ≤ −0.2 (G, n = 28 of 36; H, n = 14 of 37; I, n = 13/38), AI ≥ +0.2 (G″, n = 4 of 36; H″, n = 11 of 37; I′, n = 13 of 38) or −0.2 ≤ AI ≥ +0.2 (G′, n = 4 of 36; H′, n = 12 of 37; G″, n = 12 of 38); percentages of embryos in each category are shown on the lower right side of the polar graph. Radial axis (scale 0–6) represents the mean number of Tg(dusp6:d2EGFP)+ parapineal cells (green area) or all parapineal cells (gray area) per hemiquadrant and per embryo. In both ntl and spaw morphants, the expression of Tg(dusp6:d2EGFP) is either not clearly lateralized or lateralized with random orientation (enriched on the left or on the right side). (J) Dot plot showing, for each embryo, the AI in the number of Tg(dusp6:d2EGFP)+ cells in the left posterior versus the right posterior quadrant in control embryos (n = 36), ntl morphants (n = 37) or spaw morphants (n = 38). Left-sided lateralization of Tg(dusp6:d2EGFP) expression observed in controls is lost in both ntl and spaw morphants. The distribution of AIs is less spread in spaw morphants than in ntl morphants (P = 0.045 in F test comparing variances) showing that Tg(dusp6:d2EGFP) expression is overall less lateralized in spaw morphants than in ntl morphants. Gray-shaded zone shows AI between −0.2 and +0.2. (K) Dot plot showing, for each embryo, the number of Tg(dusp6:d2EGFP)+ parapineal cells in control embryos, ntl morphants and spaw morphants at 30 hpf. The number of Tg(dusp6:d2EGFP)+ cells is overall increased in the parapineal of spaw morphants compared with controls (P = 0.026, Welsh t test). In J and K, means ± SD are indicated as a horizontal (mean) and vertical lines (SD); statistical significance is indicated, *P < 0.05. (L) Dot plot showing, for each embryo, the mean parapineal position in micrometers distant to the brain midline (x = 0) in control embryos, ntl morphants and spaw morphants at 30 hpf. Gray-shaded zone shows parapineal mean position between −5 µm and +5 µm. In controls and ntl morphants, the parapineal had usually started to migrate, respectively, toward the left or randomly by 30 hpf, while it had not initiated migration in spaw morphants at this stage. |