
- Title
-
Optogenetic sensors in the zebrafish heart: a novel in vivo electrophysiological tool to study cardiac arrhythmogenesis
- Authors
- van Opbergen, C.J.M., Koopman, C.D., Kok, B.J.M., Knöpfel, T., Renninger, S.L., Orger, M.B., Vos, M.A., van Veen, T.A.B., Bakkers, J., de Boer, T.P.
- Source
- Full text @ Theranostics
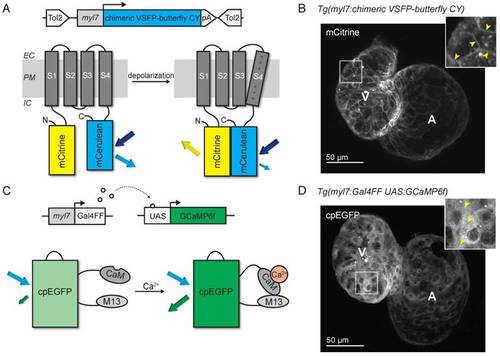
Development of voltage- and Ca2+-reporting zebrafish lines. (A) DNA construct and concept of the sensing mechanism of chimeric VSFP-butterfly CY. Chimeric VSFP-butterfly CY was placed under control of the myl7 promoter to restrict its expression to the heart. The sensor consists of a voltage sensitive domain with transmembrane segments S1-S4, sandwiched between a fluorescence resonance energy transfer (FRET) pair of the fluorescent proteins mCitrine and mCerulean. Movement of S4 upon membrane depolarization translates into a change of FRET efficiency. (B) 3D projection of a confocal image of a 3 dpf zebrafish tg(myl7:chimeric VSFP-butterfly CY) heart. Only the mCitrine channel is displayed. Insert shows a magnification of the selected ventricular area; arrowheads highlight the membrane targeting of chimeric VSFP-butterfly CY. (C) DNA construct and sensor dynamics of GCaMP6f. GCaMP6f was placed under the control of the myl7 promoter to restrict its expression to the heart. The Gal4FF-UAS system amplifies its expression. GCaMP6f consists of a circularly permutated enhanced green fluorescence protein (cpEGFP) fused to calmodulin (CaM) and the M13 peptide. When intracellular Ca2+ rises, CaM binds to M13, causing increased brightness of cpEGFP. (D) 3D projection of a confocal image of a 3dpf zebrafish tg(myl7:Gal4FF;UAS:GCaMP6f) heart. Insert shows a magnification of the selected ventricular area; arrowheads highlight cytosolic expression of GCaMP6f. CaM: calmodulin; EC: extracellular; IC: intracellular; pA: poly(A); PM: plasma membrane; tg: transgenic; UAS: upstream activation sequence. EXPRESSION / LABELING:
|
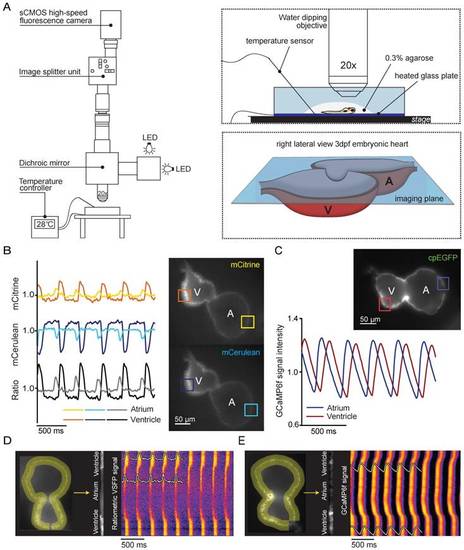
In vivo recording of voltage and Ca2+ dynamics in the embryonic zebrafish heart. (A) Recordings were performed using a custom-built upright widefield microscope equipped with a 20x objective, LED excitation light, an emission splitter unit and a high-speed fluorescence camera. Embryos were embedded in 0.3% agarose and placed in a temperature-controlled water bath. Temperature was regulated using a heated glass plate and a temperature sensor. A schematic depiction of the focal plane through the embryonic heart is visible in the right bottom frame. (B) Using the high-speed epifluorescence microscope, movies of 3 dpf non-contracting chimeric VSFP-butterfly CY embryonic hearts were recorded. Signal analysis demonstrated an increase in mCitrine (top panel) and decrease in mCerulean (bottom panel) every consecutive excitation cycle, starting in the atrium and followed by the ventricle. From these signals, a ratiometric signal could be calculated to study action potential (AP) configuration in both chambers. The selected atrial or ventricular regions are indicated by square boxes superimposed on the fluorescence images. (C) Movies of 3 dpf non-contracting GCaMP6f embryonic hearts were recorded and signal analysis demonstrated a clear oscillatory Ca2+ signal, starting in the atrium and followed by the ventricle. (D-E) Line plots of both chimeric VSFP-butterfly CY and GCaMP6f signals illustrating electrical impulse (D) and Ca2+ propagation (E) throughout the heart. Background-corrected fluorescence intensities were averaged across the width of the myocardial wall and along a trajectory defined by the course of the wall. Signal heat maps of trajectory against time depict depolarizations of the membrane (D) or increases in intracellular Ca2+ (E). The chimeric VSFP-butterfly CY line plot (D) clearly shows that APs originate in the atrium, have a small delay at the atrioventricular canal (AVC) and then rapidly spread throughout the ventricle. White insets represent the spatial AP traces, visible is the longer AP duration in the ventricle as compared to the atrium, as well as the regularity of the activation intervals. Analysis of GCaMP6f signal intensity versus time (E) also shows a clear activation pattern from atrium to ventricle. White insets represent the spatial Ca2+ transients, showing a faster speed of intracellular Ca2+ release in the atrium versus ventricle, similar speed in Ca2+ reuptake/clearance between chambers and nice regularity of activation intervals. A: atrium; cpEGFP: circularly permutated enhanced green fluorescent protein; V: ventricle. EXPRESSION / LABELING:
|

ZFIN is incorporating published figure images and captions as part of an ongoing project. Figures from some publications have not yet been curated, or are not available for display because of copyright restrictions. PHENOTYPE:
|
|
ZFIN is incorporating published figure images and captions as part of an ongoing project. Figures from some publications have not yet been curated, or are not available for display because of copyright restrictions. PHENOTYPE:
|
|
ZFIN is incorporating published figure images and captions as part of an ongoing project. Figures from some publications have not yet been curated, or are not available for display because of copyright restrictions. PHENOTYPE:
|
|
ZFIN is incorporating published figure images and captions as part of an ongoing project. Figures from some publications have not yet been curated, or are not available for display because of copyright restrictions. PHENOTYPE:
|
|
ZFIN is incorporating published figure images and captions as part of an ongoing project. Figures from some publications have not yet been curated, or are not available for display because of copyright restrictions. PHENOTYPE:
|