
- Title
-
Adult spinal motoneurons change their neurotransmitter phenotype to control locomotion
- Authors
- Bertuzzi, M., Chang, W., Ampatzis, K.
- Source
- Full text @ Proc. Natl. Acad. Sci. USA

Analysis of the glutamatergic phenotype of adult spinal motoneurons. (A) Whole-mount fluorescence image of retrogradely traced motoneurons (MNs; magenta) and glutamate immunohistochemistry (green). (B) Percentages of the retrogradely traced motoneurons that express glutamate (n = 12 zebrafish). (C) Spatial distributions of the glutamate+ (solid circles) and glutamate− (open circles) immunoreactive motoneurons (n = 5 zebrafish). (D) Whole-mount immunofluorescent images (Top) showing the glutamatergic expression (green) in different motoneuron pools (magenta). Analysis of the soma sizes and dorsoventral locations of the glutamate and nonglutamate expressing motoneurons (Bottom). (E) The significantly differing percentages of retrogradely traced motoneurons that express glutamate in slow, intermediate, and fast pools (P < 0.0001, one-way ANOVA). (F) Glutamate-positive fast motoneurons (solid circles) were smaller (P < 0.0001, unpaired t-test) and located more ventrally (P = 0.0208, unpaired t-test) than the nonglutamate fast motoneurons (open circles). Arrows indicate the double-labeled cells. Asterisks indicate glutamate immunonegative motoneurons. Data are presented as mean ± SEM and as box plots showing the median and 25th and 75th percentile (box and line) and minimal and maximal values (whiskers). *P < 0.05; **P < 0.01; ****P < 0.0001. For detailed statistics see SI Appendix, Table S1. |

Respecification of motoneuron glutamatergic phenotype. (A) Representative whole-mount confocal images showing glutamatergic expression in axial motoneurons (MNs) of control animals, after swim training and after SCI. (B) Quantification of numbers of axial motoneurons. (C) Changes in percentages of axial motoneurons that coexpressed glutamate after swim training or SCI (P < 0.0001, one-way ANOVA). (D) The percentage of slow and intermediate motoneurons that expressed glutamate remained unchanged following these perturbations. (E) The percentage of glutamate+ fast motoneurons increased after training or SCI (P < 0.0001, one-way ANOVA). Quantification of soma sizes and locations of the glutamate+ fast motoneurons suggests that the larger motoneurons (P = 0.0099, one-way ANOVA) located in the dorsal part (P = 0.0089, one-way ANOVA) of the motor column retain ability to respecify their neurotransmitter phenotype. (F) Schematic representation of the three distinct pools of motoneurons observed in adult zebrafish spinal cord. Approximately 20% of the fast motoneurons constitute the reserve pool and retain ability to respecify their neurotransmitter phenotype. Arrows indicate the double-labeled cells. Data are presented as mean ± SEM; *P < 0.05; **P < 0.01; ***P < 0.001; ****P < 0.0001; ns, not significant. For detailed statistics see SI Appendix, Table S1. |

Neuromuscular effects of glutamate. (A) Distribution of glutamate in indicated types of muscle fibers in control animals and after training and after SCI. (B and C) Quantification of the normalized intensity of the glutamate staining in different muscle fibers (P = 0.0006, RM one-way ANOVA) and after the training and SCI (fast: P = 0.0022, one-way ANOVA). (D) Expression of VGluT1, but not VGluT2, in the area surrounding the muscle fibers (dotted borders); VGluT1 expression near NMJs (indicated by α-ΒΤΧ) and in close proximity to or colocalized with the expression of the vesicular ACh transporter (VAChT, Arrow). (E) Microphotograph of isolated axial muscles from adult zebrafish used for whole-cell voltage-clamp recordings. Bath application of NMDA increases the EPC frequency in both slow (P = 0.0008, one-way ANOVA, n = 7 zebrafish) and fast muscle fibers (P = 0.0006, one-way ANOVA, n = 8 zebrafish). (F) EPCs events (n = 5 zebrafish/3 sweeps) induced after stimulation (arrows; onset, 0 s) were significantly decreased in presence of the selective NMDA receptor antagonist AP-5 (50 μΜ; P = 0.0279, RM one-way ANOVA). (G) Expression of NMDA receptor subunit 2B (green) in motoneuron terminals at NMJs (indicated by α-ΒΤΧ; magenta). (H) Proposed model of adult zebrafish NMJs. (I) Fast muscle fibers showed a significant increase in EPC frequencies following training and SCI (P = 0.0191, one-way ANOVA). Whole-cell voltage-clamp recordings were obtained at a holding potential of −70 mV in all recordings. Data are presented as mean ± SEM and as box plots showing the median and 25th and 75th percentile (box and line) and minimal and maximal values (whiskers). *P < 0.05; **P < 0.01; ***P < 0.001; ns, not significant. For detailed statistics see SI Appendix, Table S1. |
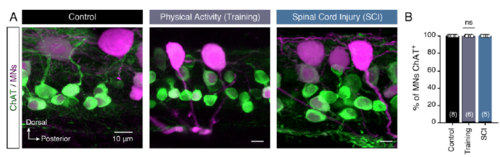
Motoneurons always remain cholinergic. (A) Representative whole mount confocal images showing ChAT immunoreactivity of retrograde labelled spinal motoneurons in control, after training and following spinal cord injury (SCI). (B) Quantification of the spinal motoneurons positive for ChAT immunolabeling. Data are presented as mean ± SEM; ns, non-significant. |

Neuromuscular junctions remain the same after training and spinal cord injury. (A) Representative transverse confocal images from adult zebrafish myotome (purple) showing the location and the number of the neuromuscular junctions (α-BTX; green) in control and after physical exercise and spinal cord injury. (B) Quantification of the normalized intensity of the α-BTX staining in slow, intermediate and fast muscle fibers show no significant changes following training and spinal cord injury. Data are presented as boxplots showing the median, 25th and 75th percentile (box and line), minimal and maximal values (whiskers), mean ± SEM; ns, non-significant; IM, intermediate. For detailed statistics see SI Appendix, Table S1. |