
- Title
-
The mechanical impact of col11a2 loss on joints; col11a2 mutant zebrafish show changes to joint development and function, which leads to early-onset osteoarthritis.
- Authors
- Lawrence, E.A., Kague, E., Aggleton, J.A., Harniman, R.L., Roddy, K.A., Hammond, C.L.
- Source
- Full text @ Phil. Trans. Roy. Soc. Lond., Series B

col11a2 zebrafish mutant larvae show progressively altered type II collagen protein localization in jaw cartilage. (a,b) Maximum projection of ventral and lateral confocal image stacks from wt (a) and homozygous mutant (col11a2−/−) (b) larvae immunostained for type II collagen at three time points (3, 5 and 7 dpf). White arrows indicate areas of change in type II collagen distribution in the ECM. Dashed insets show single-stack images of regions with reduced deposition (white asterisks represent areas where type II collagen is maintained in mutant fish and red asterisks show fragments of type II collagen-positive material outside the main cartilage elements). Red arrows show interoperculomandibular (IOM) ligament. Scale bar, 100 µm. EXPRESSION / LABELING:
|

col11a2 mutant zebrafish develop altered morphology and joint spacing in the lower jaw. (a,b) Lower-jaw shape quantification (n = 3 for all), location of measurements shown to the left of graphs. (c) Representation of measurements taken of joint neck (red line), joint head (green line) and joint space (white line) (Meckel's cartilage, light blue; palatoquadrate, dark blue). Orientation compass: A, anterior; L, lateral; M, medial; P, posterior. (d) Three-dimensional surface renders of jaw joint from confocal images of wt and col11a2−/− at 3, 5 and 7 dpf. Red arrowheads, areas of change. (e–g) Quantification of joint morphology at the Meckel's cartilage neck at joint (e), Meckel's cartilage head at joint (f) and joint space (g) (n = 3 for all). (h) Three-dimensional volume renders of wt and col11a2−/− zebrafish at 7 dpf. Dashed insets show Meckel's symphysis at higher magnification (red arrowheads, protruding cells). (i) Quantification of protruding cells in wt and col11a2−/− zebrafish at 3–7 dpf (n = 3, 3, 4, 4, 13, 6, 8, 6). (j) Quantification of cell circularity in the Meckel's cartilage in 5 dpf wt and col11a2−/− fish (n = 3 for all). Location of measurements shown in h (red box, Meckel's symphysis; blue box, mid-element; green box, jaw joint). Student's unpaired t-tests performed in a, b, e–g, i and j: data are mean with SEM (j shows mean with no SEM, t-tests performed between mean values). *p ≤ 0.05, **p ≤ 0.01, ***p ≤ 0.001. |
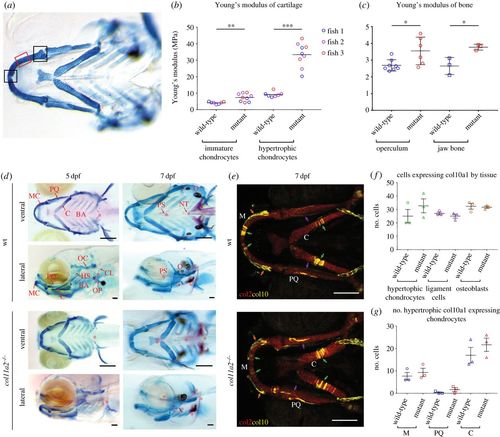
col11a2 mutants have altered material properties in more mature cartilage which is not explained by increased mineralization or hypertrophy. Location of AFM measurements taken from larvae shown in (a). Measurements for immature chondrocytes taken from either of the two areas marked by black boxes, measurements for hypertrophic chondrocytes taken from area marked by red box. (b,c) YM values for (b) immature and hypertrophic chondrocytes in wt and col11a2−/− (n = 3 for both) at 7 dpf and (c) adult bone from the operculum and jaw in wt (n = 8 and 3, respectively) and col11a2−/− (n = 6 and 3, respectively). (d) Ventral and lateral views of Alizarin red Alcian blue staining show GAGs in cartilage (stained in blue) and mineralization (stained in red) in wt and col11a2−/− fish at 5 and 7 dpf. Red asterisks indicate areas of bone formation. MC, Meckel's cartilage; PQ, palatoquadrate; C, ceratohyal; BA, branchial arches; HS, hyosymplectic; OC, otic capsule; OP, operculum; CL, cleithrum; PS, parasphenoid; NT, notochord tip; O, otoliths. Scale bar, 200 µm. (e) col10a1aBAC:citrine;col2:mCherry transgenic line shows type X (yellow) and type II (red) collagen in wt and col11a2−/− zebrafish at 7 dpf. Scale bar, 100 µm. (f) Quantification of col10a1-expressing cells in hypertrophic chondrocytes, IOM ligament cells and osteoblasts in the lower jaw at 7 dpf (position of each cell type shown by green, purple and orange arrows in (e), respectively) (n = 3 for all). (g) Quantification of col10a1-expressing hypertrophic chondrocytes in 7 dpf wt and col11a2−/− fish (n = 3 for all) (M, Meckel's cartilage; PQ, palatoquadrate; C, ceratohyal). Student's unpaired t-tests were performed in b, c, f and g, data are mean with s.e.m. (b shows mean with no s.e.m.). *p ≤ 0.05, **p ≤ 0.01, ***p ≤ 0.001. |

Shape changes in col11a2 zebrafish mutants have a greater effect on jaw biomechanics than material property changes. (a,b) FE models of maximum (EMax) and minimum (EMin) principal strain during mouth opening in 7 dpf wt and col11a2−/− zebrafish. Red arrowheads, areas of high strain; black arrowheads, areas of low strain; black asterisks, jaw joint. (a) wt jaw shape with wt material properties and col11a2−/− shape with col11a2−/− material properties. (b) wt shape with col11a2−/− material properties and col11a2−/− shape with wt material properties. Ventral and lateral views shown for each condition. |

col11a2 mutant zebrafish have abnormal jaw movement at 5 dpf. (a) Stills from high-speed movies show range of jaw movement in wt and col11a2−/−. (b,c) Analysis of (b) total jaw movements and (c) range of movement at two locations shown in (a): red line, mouth; blue line, buccal joint (n= 7 for all). Student's unpaired t-tests performed for b and c, data are mean with SEM. *p ≤ 0.05, ***p ≤ 0.001. PHENOTYPE:
|

Mutations in zebrafish col11a2 result in changes that trigger premature OA. (a,b) Three-dimensional renders from µCTs of 1-year-old wt and col11a2 heterozygous mutant (col11a2+/−). (a) Yellow arrow, jaw joint; dashed green arrow, region of jaw protrusion in col11a2+/−; green arrow, region of hypoplasia in fronto-nasal skeleton. (b) Higher magnification image of joint region where dashed yellow line, inter-joint space. (c,d) Paraffin sections of the jaw joint stained with (c) Alcian blue and haematoxylin/eosin and (d) PicroSirius red. Dashed black line, cartilage layer; black arrows, underlying bone; dashed white line, cartilage; white arrow, bone (green). (e) SHG, asterisks pointing to areas of thinner fibres not detected by SHG, red arrows, thicker collagen bundles on abnormal orientation. Scale bars, 50 µm. |
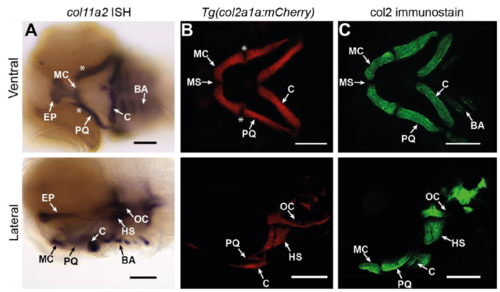
col11a2 and col2a1 are largely co-expressed in the zebrafish lower jaw. A-C) Ventral and lateral views of zebrafish at 3dpf. A) In situ hybridisation (ISH) for col11a2 shows its expression in the zebrafish Meckel's cartilage (MC), Palatoquadrate (PQ), ceratohyal (C), and branchial arches (BA) observed ventrally, and the ethmoid plate (EP), otic capsule (OC) and hyosymplectic (HS) laterally. B) The pattern of expression of col11a2 overlaps that of col2a1, visualised with zebrafish carrying Tg(col2a1a:mCherry). White asterisks = joint region. C) immunostaining for Type II collagen (col2) indicates protein deposition in the same domains that col11a2 is expressed, except the jaw joint. Scale bar = 100 µm EXPRESSION / LABELING:
|

col2a1 expression in craniofacial cartilages is unaffected by loss of col11a2. Ventral and lateral views of wt (A) and col11a2-/- (B) zebrafish carrying Tg(col2a1a:mCherry). MC = Meckel's Cartilage, PQ = palatoquadrate, C = ceratohyal, HS = hyosymplectic, OC = otic capsule and BA = branchial arches, Scale bar = 100 µm EXPRESSION / LABELING:
|
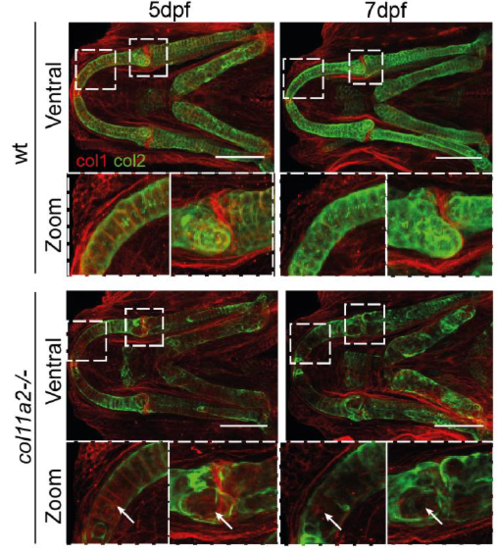
Type 1 collagen is not increased in col111a2 mutants. Immunostaining for Type 1 (red) and Type II (green) collagen in wt and col11a2 -/- at 5 and 7dpf. Dashed insets show areas of higher magnification. White arrows indicate areas of Type II collagen loss, where Type I collagen is unchanged. Scale bar = 100 µm |

Segmentation of lower jaw elements and assignment of material property values. A) The Meckel's cartilage (white), palatoquadrate (blue) and ceratohyal (red) were segented from confocal images of 7dpf wt and col11a2 -/- zebrafish. B) Material properties from Atomic Force Microscopy were applied to the corresponding regions of the lower jaw. Dark red = immature chondrocytes in the joint regions, grey = hypertrophic chondrocytes towards the middle of the cartilage element, and green = joint. TAble 1) Material property values used for Finite Element model generation (MPa = megapascals). |

Shape changes in col11a2 zebrafish mutants have greater affect on jaw biomechanics than material property changes. A,B) Finite Element (FE) models of maximum (E. Max) and minimum (E. Min) principal strain during mouth closing in 7dpf wt and col11a2-/- zebrafish. Red arrowheads = areas of high strain, black asterisks = jaw joint. A) wt jaw shape with wt material properties and col11a2-/- shape with col11a2-/- material properties. B) wt shape with col11a2-/- material properties and col11a2--/- shape with wt material properties. Ventral and lateral views shown for each. |
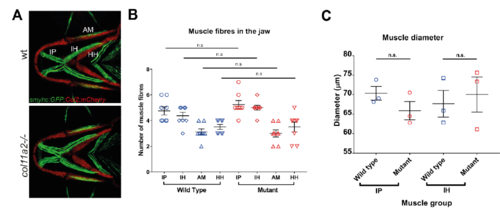
Mutation of col11a2 does not alter muscle fibre number or diameter at 5dpf. A) smyhc:gfp;col2a1:mCherry transgenic line shows slow myosin in muscle (green) and Type II collagen (red) in wt and col11a2-/- zebrafish at 5dpf. B) Quantification of muscle fibre number in four muscles in the jaw in wt and col11a2-/- zebrafish (n = 5 and 8 respectively). C) Quantification of muscle diameter in two muscles in the lower jaw, observed through birefringence in wt and col11a2-/- zebrafish at 5dpf (n=3 for all). Locations of muscles are labelled and shown in (A) (IP = Intermandibularis posterior, IH = interhyoideus, AM = adductor mandibulae, HH = hyohyoideus). Student's unpaired t-tests were performed in B and C, data is mean with SEM. Scale bar = 100 µm. n.s = P>0.05 EXPRESSION / LABELING:
|