
- Title
-
Il34-Csf1r Pathway Regulates the Migration and Colonization of Microglial Precursors
- Authors
- Wu, S., Xue, R., Hassan, S., Nguyen, T.M.L., Wang, T., Pan, H., Xu, J., Liu, Q., Zhang, W., Wen, Z.
- Source
- Full text @ Dev. Cell
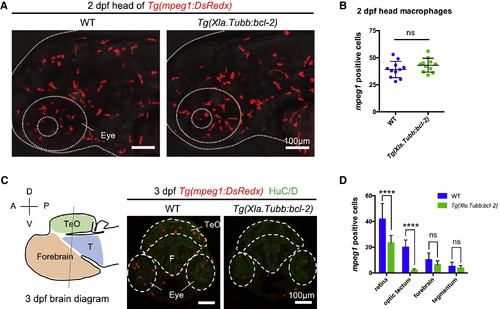
Inhibition of Neuronal Apoptosis Does Not Completely Block Microglia Colonization (A and B) Lateral view of the head region (A) and quantification (B) of the number of macrophages in the head of 2-dpf WT or Tg(Xla.Tubb:bcl-2) embryos. Macrophages were labeled by Tg(mpeg1:DsRedx) (red). The head is indicated by dotted lines. n = 11 for each group. Values represent means ± SD. (C) Left: schematic diagram of the 3-dpf zebrafish brain showing the different brain regions. Right: representative transverse sections through the midbrain and hindbrain in 3-dpf WT or Tg(Xla.Tubb:bcl-2) embryos, with macrophages labeled by Tg(mpeg1:DsRedx) (red) and neurons labeled by HuC/D immunostaining (green). Different CNS regions are indicated by dashed lines. The diagram is modified from the Atlas of Early Zebrafish Brain Development: A Tool for Molecular Neurogenetics [M]. Academic Press, 2015. A, anterior; P, posterior; D, dorsal; V, ventral; TeO, optic tectum; T, tegmentum; F, forebrain. (D) Quantification of DsRedx+ microglia in different CNS regions of 3-dpf WT Tg(mpeg1:DsRedx) or Tg(Xla.Tubb:bcl-2;mpeg1:DsRedx) embryos. n = 11 for each group. Values represent means with SD. For multiple comparisons, see also Table S1. ns, p > 0.05; ∗∗∗∗p ≤ 0.0001. EXPRESSION / LABELING:
PHENOTYPE:
|
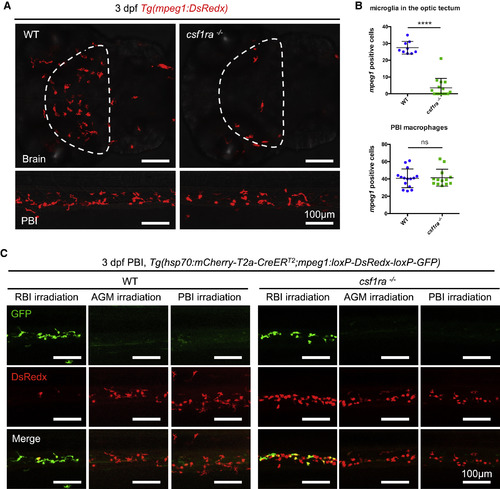
csf1ra Deficiency Blocks the Colonization of Microglia but Not Peripheral Macrophages (A and B) Representative images (A) and quantification (B) of macrophages in the brain (upper panel) or the PBI (lower panel) of 3-dpf WT or csf1ra−/− embryos. Macrophages were labeled by Tg(mpeg1:DsRedx) (red). The optic tectum is indicated by dashed lines. n = 9, 15, 15, and 13 for WT microglia, csf1ra−/− microglia, WT PBI macrophages, and csf1ra−/− PBI macrophages, respectively. Values represent means ± SD. (C) Double-transgenic Tg(hsp70:mCherry-T2a-CreERT2;mpeg1:loxP-DsRedx-loxP-GFP) WT or csf1ra−/− embryos were irradiated using an infrared (IR) laser in the RBI, AGM, and PBI region at 14 hpf, 28 hpf, and 22 hpf, respectively, to induce expression of CreER. After 4-hydroxytamoxifen (4-OHT) treatment, CreER mediates loxP recombination and results in GFP expression. Images show the GFP+ and DsRedx+ macrophages in the PBI region of 3-dpf irradiated embryos in the respective group. ns, p > 0.05; ∗∗∗∗, p ≤ 0.0001. EXPRESSION / LABELING:
PHENOTYPE:
|
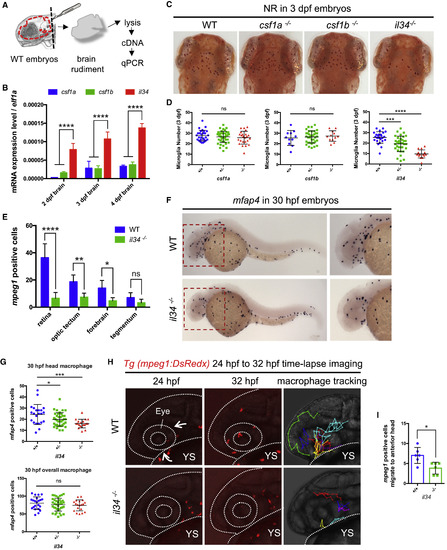
il34 Deficiency Affects the Colonization of Microglial Precursors (A) Schematic diagram showing the brain rudiment taken from the head of embryos and used for subsequent cDNA library construction. (B) qRT-PCR of csf1a, csf1b, and il34 expression in the brain rudiments of 2-dpf, 3-dpf, and 4-dpf WT embryos. Pooled data from two or three separate experiments. n = 20 for each single experiment. Values represent means with SD. (C and D) Neutral red (NR) staining showing microglia in 3-dpf WT, csf1a−/−, csf1b−/−, and il34−/− embryos (C) and quantification (D) of NR+ microglia in the optic tectum of embryos with indicated genotype. n = 28, 47, and 24 for csf1a+/+, csf1a+/−, and csf1a−/− embryos, respectively. n = 11, 36, and 12 for csf1b+/+, csf1b+/−, and csf1b−/− embryos, respectively. n = 25, 35, and 16 for il34+/+, il34+/−, and il34−/− embryos, respectively. Values represent means ± SD. (E) Quantification of DsRedx+ microglia in different CNS regions of 3-dpf WT Tg(mpeg1:DsRedx) or il34−/−;Tg(mpeg1:DsRedx) embryos. n = 6 for each group. Values represent means with SD. See also Figure S4C. (F and G) Whole-mount in situ hybridization (WISH) showing mfap4 expression in 30-hpf WT or il34−/− embryos (F) and quantification (G) of mfap4+ macrophages in the head region (upper panel) or the whole embryos (lower panel) with indicated genotype. n = 22, 37, and 19 for il34+/+, il34+/−, and il34−/− embryos, respectively. Values represent means ± SD. (H) Time-lapse imaging of the head region of WT Tg(mpeg1:DsRedx) and il34−/−;Tg(mpeg1:DsRedx) embryos from 24 hpf to 32 hpf showing the migration of DsRedx+ macrophages to the anterior head regions. Left and middle panels show the beginning (24 hpf) and end (32 hpf) of time-lapse imaging, and right panels show the cell tracking of DsRedx+ macrophages entering the anterior head region. In WT embryos, DsRedx+ macrophages migrate to the anterior head regions from two preferential routes (arrows), while in il34−/− mutants DsRedx+ macrophages rarely reached the anterior head region. The head is indicated by dotted lines. YS, yolk sac. See also Videos S1 and S2. (I) Quantification of DsRedx+ macrophages migrate to the anterior head regions in the time-lapse imaging of WT Tg(mpeg1:DsRedx) and il34−/−;Tg(mpeg1:DsRedx) embryos from 24 hpf to 32 hpf. n = 6 for each group. Values represent means ± SD. See also S2. ns, p > 0.05; ∗p ≤ 0.05; ∗∗p ≤ 0.01; ∗∗∗p ≤ 0.001; ∗∗∗∗p ≤ 0.0001. EXPRESSION / LABELING:
PHENOTYPE:
|
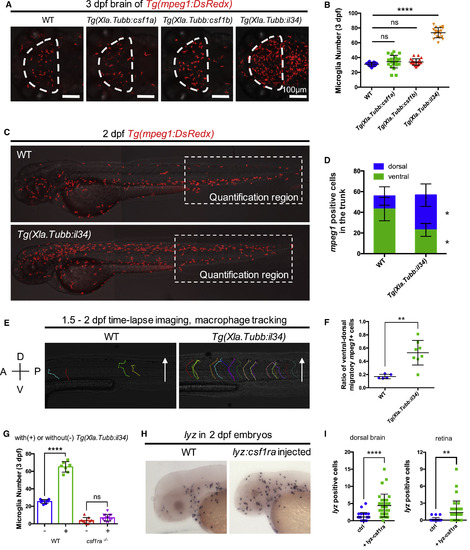
Il34-Csf1ra Pathway Is Sufficient for the Colonization of Microglial Precursors (A and B) Representative images (A) and quantification (B) of microglia in the optic tectum of 3-dpf WT (n = 17), Tg(Xla.Tubb:csf1a) (n = 22), Tg(Xla.Tubb:csf1b) (n = 20), and Tg(Xla.Tubb:il34) (n = 19) embryos. Microglia were labeled by Tg(mpeg1:DsRedx) (red). The optic tectum is indicated by dashed lines. Values represent means ± SD. (C and D) Representative images of 2-dpf WT and Tg(Xla.Tubb:il34) embryos showing the distribution of macrophages (C) and quantification of macrophages in the dorsal and ventral region of the trunk in the dashed box region (D). Macrophages were labeled by Tg(mpeg1:DsRedx) (red). n = 14 and 17 for WT and Tg(Xla.Tubb:il34) embryos, respectively. Values represent means ± SD. (E and F) Time-lapse imaging of the trunk of WT Tg(mpeg1:DsRedx) (n = 5) and Tg(Xla.Tubb:il34;mpeg1:DsRedx) embryos (n = 8) from 36 hpf to 2 dpf, showing the cell tracking (E) and quantification (F) of DsRedx+ macrophages migrating from the ventral trunk region to the dorsal spinal cord region. Values represent means ± SD. A, anterior; P, posterior; D, dorsal; V, ventral. See also Videos S3 and S4. (G) Quantification of NR+ microglia number in the optic tectum of 3-dpf WT and csf1ra−/− embryos with or without the Tg(Xla.Tubb:il34) transgene. n = 8, 7, 9, and 15 for WT, WT with Tg(Xla.Tubb:il34), csf1ra−/−, and csf1ra−/− with Tg(Xla.Tubb:il34), respectively. Values represent means ± SD. See also Figure S5G. (H and I) WISH showing lyz expression (H) and quantification of lyz+ neutrophils in the dorsal brain (I, left) and retina (I, right) of 2-dpf WT or lyz:csf1ra-injected embryos. n = 26, 32, 26, and 32 for WT dorsal brain, injected dorsal brain, WT retina, and injected retina, respectively. Values represent means ± SD. ns, p > 0.05; ∗p ≤ 0.05; ∗∗p ≤ 0.01; ∗∗∗∗p ≤ 0.0001. EXPRESSION / LABELING:
PHENOTYPE:
|
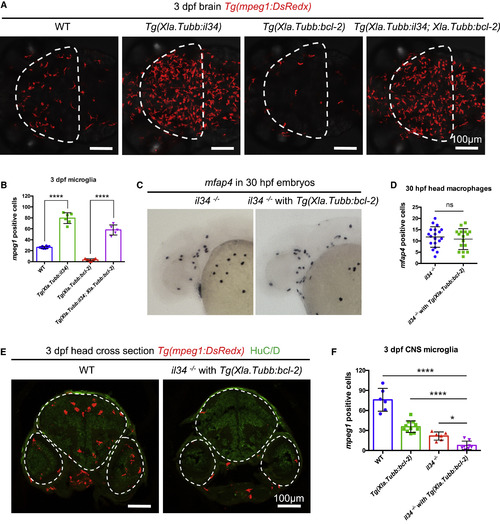
Il34-Csf1ra Pathway and Neuronal Apoptosis Collaboratively Orchestrate Microglia Colonization (A and B) Representative images (A) and quantification (B) of microglia in the optic tectum of 3-dpf WT (n = 8), Tg(Xla.Tubb:il34) (n = 6), Tg(Xla.Tubb:bcl-2) (n = 13), and Tg(Xla.Tubb:il34;Xla;Tubb:bcl-2) (n = 5) embryos. Microglia were labeled by Tg(mpeg1:DsRedx) (red). The optic tectum is indicated by dashed lines. Values represent means with SD. (C and D) WISH showing mfap4 expression (C) and quantification (D) of mfap4+ macrophages in the head region of 30-hpf il34−/− embryos or Tg(Xla.Tubb:bcl-2);il34−/− embryos. n = 19 and 16 for il34−/− and Tg(Xla.Tubb:bcl-2);il34−/− embryos, respectively. Values represent means ± SD. (E and F) Representative transverse sections through the midbrain and hindbrain of 3-dpf WT or Tg(Xla.Tubb:bcl-2);il34−/− embryos (E), with macrophages labeled by Tg(mpeg1:DsRedx) (red), neurons labeled by HuC/D immunostaining (green), and quantification of DsRedx+ microglia in the whole CNS (F). The CNS region is indicated by dashed lines. n = 6, 11, 6, and 8 for WT, Tg(Xla.Tubb:bcl-2), il34−/−, and Tg(Xla.Tubb:bcl-2);il34−/− embryos, respectively. Values represent means with SD. ns, p > 0.05; ∗p ≤ 0.05; ∗∗∗∗p ≤ 0.0001. EXPRESSION / LABELING:
PHENOTYPE:
|
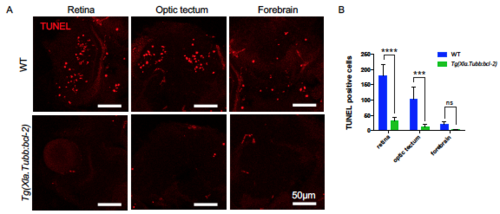
Tg(Xla.Tubb:bcl-2) Transgene Successfully Blocks Neuronal Apoptosis in Most CNS Regions. Related to Figure 1. (A and B) Whole mount Terminal deoxynucleotidyl transferase dUTP nick end labeling (TUNEL) assay followed by transverse section showing representative images of apoptotic cells (red) (A) and quantification (B) of apoptotic cells in different CNS regions of 3 dpf WT or Tg(Xla.Tubb:bcl-2) embryos injected with pu.1 morpholino. n = 4 and 3 for WT and Tg(Xla.Tubb:bcl-2) embryos, respectively. Values represent means with SD. ns, P>0.05; ***, P ≤ 0.001; ****, P ≤ 0.0001. PHENOTYPE:
|
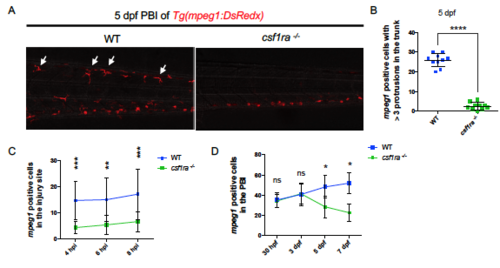
Csf1ra Mutants Show General Deficiencies in Peripheral Macrophages. Related to Figure 2. (A and B) Representative images showing the peripheral macrophages (A) and quantification (B) of mature ramified macrophages with at least 3 protrusions (arrows) in the trunk region of 5 dpf WT or csf1ra-/- embryos. Macrophages were labeled by Tg(mpeg1:DsRedx) (red). n = 10 for each group. Values represent means with SD. (C) Injuries were performed in the tail fins of 2 dpf WT Tg(mpeg1:DsRedx) (n = 10) or csf1ra-/-; Tg(mpeg1:DsRedx) embryos (n = 13), and responding DsRedx+ macrophages were quantified in the injury site at 4 hours post injury (hpi), 6 hpi and 8 hpi, respectively. Values represent means ± SD. (D) Quantification of DsRedx+ macrophages in the PBI region of 30 hpf, 3 dpf, 5dpf and 7dpf WT Tg(mpeg1:DsRedx) or csf1ra-/-; Tg(mpeg1:DsRedx) embryos. n ranges from 6 to 16 for each group. Values represent means ± SD. ns, P>0.05; *, P ≤ 0.05; **, P ≤ 0.01; ***, P ≤ 0.001; ****, P ≤ 0.0001. PHENOTYPE:
|
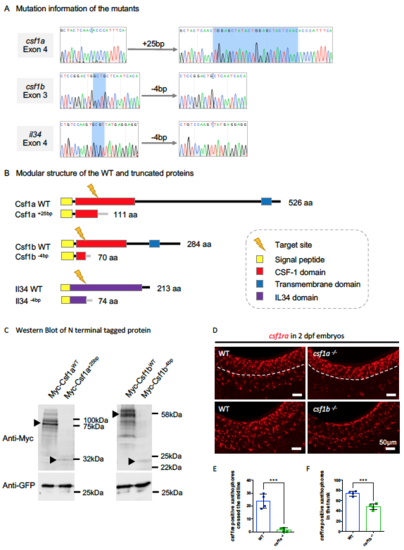
Characterization of the Three Ligand Mutants. Related to Figure 3. (A) Sequencing result flanking the target sites in the indicated exon of the three respective genes showing small fragment insertions or deletions (highlighted by blue). (B) Predicted modular structure of the WT and truncated proteins resulting from frame shifts in the open reading frame in the respective mutants. (C) Western blotting showing the expression of N-terminal tagged Myc-Csf1aWT, Myc- Csf1a+25bp, Myc-Csf1bWT and Myc-Csf1b-4bp upon transfection in HEK293T. GFP expressing construct was co-transfected as a control. Protein bands in accord with the predicted size were indicated by arrowheads, with the frameshift mutations generating truncated proteins that are relatively unstable compared with their WT counterparts. (D) WISH showing the expression of csf1ra, a marker for both macrophages and neural crest-derived xanthophores, in 2 dpf WT, csf1a-/- and csf1b-/- embryos. In the WT embryos, csf1ra+ xanthophores spread out across the surface of the trunk, while in csf1a-/- embryos, csf1ra+ xanthophores differentiated normally from the neural crest, but failed to cross the midline (dashed lines). In csf1b-/- embryos, there are fewer csf1ra+ xanthophores in the trunk. (E and F) Quantification of csf1ra+ xanthophores crossed the midline in 2 dpf WT and csf1a-/- embryos (E) and overall csf1ra+ xanthophores in the trunk region of 2 dpf WT and csf1b-/- embryos (F) . n = 4 for each group. Values represent means ± SD. ***, P ≤ 0.001. |
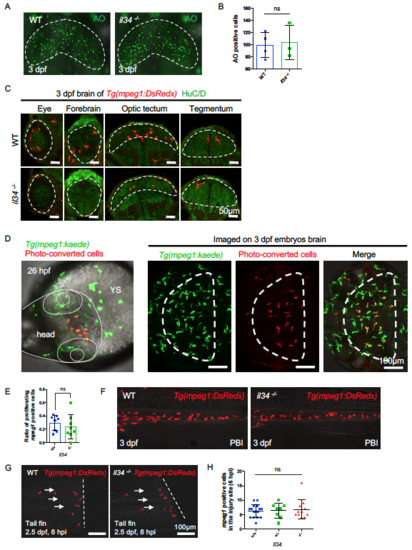
Characterization of il34 Mutant Embryos. Related to Figure 3. (A and B) Acridine orange (AO) staining showing apoptotic neurons (A) and quantification (B) of apoptotic neurons in the optic tectum of 3dpf WT or il34-/- embryos injected with pu.1 morpholino. The optic tectum is indicated by dashed lines. n = 4 and 3 for WT and il34-/- embryos, respectively. Values represent means with SD. (C) Transverse sections showing microglia in different CNS regions of 3 dpf WT or il34-/- embryos, with macrophages labeled by Tg(mpeg1:DsRedx) (red) and neurons labeled by HuC/D immunostaining (green). Different CNS regions are indicated by dashed lines. Related to Figure 3E. (D) 10 Kaede+ (before-convert: green) macrophages in the anterior head region of 26 hpf Tg(mpeg1:kaede) embryos were photo-converted (after-convert: red). Images taken at 3 dpf showing the successful colonization of converted macrophages (red) in the optic tectum. The head is indicated by dotted lines and the optic tectum is indicated by dashed lines. YS, yolk sac. (E) Quantification of the ratio of proliferating DsRedx+ macrophages in total head macrophages in the time-lapse imaging of WT Tg(mpeg1:DsRedx) or il34-/-; Tg(mpeg1:DsRedx) embryos from 30 hpf to 34 hpf. n = 8 for each group. Values represent means ± SD. (F) Representative images of macrophages in the PBI region of 3 dpf WT or il34-/- embryos. Macrophages were labeled by Tg(mpeg1:DsRedx) (red). (G and H) Representative images (left) and quantification (right) of macrophages accumulating in the injury sites 6 hours after injuries performed in the tail fins of 2 dpf il34+/+ (n = 16), il34+/- (n = 8) and il34-/- (n = 11) embryos. Macrophages were labeled by Tg(mpeg1:DsRedx) (red). Values represent means ± SD. ns, P>0.05. PHENOTYPE:
|
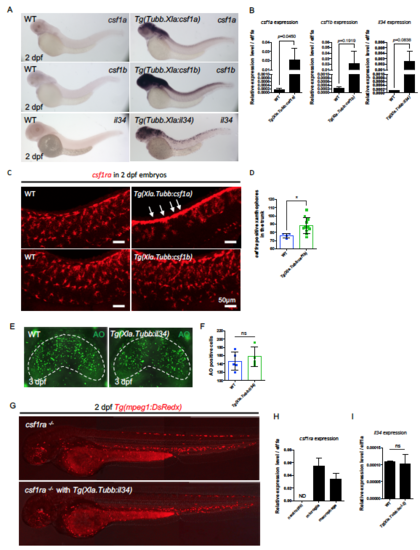
Characterization of Ligand Overexpression Transgenic Embryos. Related to Figure 4 and Figure 5. (A) WISH showing representative overexpression of csf1a, csf1b and il34 in 2 dpf WT, Tg(Xla.Tubb:csf1a), Tg(Xla.Tubb:csf1b) and Xla.Tubb:il34 injected embryos, respectively. (B) Quantitative RT-PCR of csf1a, csf1b and il34 expression in the respective overexpression embryos at 2 dpf. Pooled from three separate experiments. n = 7 for each single experiment. Values represent means with SD. (C) WISH showing the expression of csf1ra in 2 dpf WT, Tg(Xla.Tubb:csf1a), and Tg(Xla.Tubb:csf1b) embryos. In Tg(Xla.Tubb:csf1a) embryos, there are many csf1ra+ xanthophores stayed in the neural crest region and failed to spread out (arrows). In Tg(Xla.Tubb:csf1b) embryos, there are more csf1ra+ xanthophores in the trunk. (D) Quantification of csf1ra+ xanthophores in the trunk region of 2 dpf WT (n = 4) and csf1b-/- embryos (n = 11). Values represent means ± SD. (E and F) AO staining showing apoptotic neurons (C) and quantification (D) of apoptotic neurons in the optic tectum of 3dpf WT or Tg(Xla.Tubb:il34) embryos injected with pu.1 morpholino. The optic tectum is indicated by dashed lines. n = 5 and 4 for WT and Tg(Xla.Tubb:il34) embryos, respectively. Values represent means with SD. (G) Representative images showing macrophage distribution in 3 dpf csf1ra-/- and csf1ra-/-; Tg(Xla.Tubb:il34) embryos. Macrophages were labeled by Tg(mpeg1:DsRedx) (red). Related to Figure 4G. (H) Quantitative RT-PCR of csf1ra expression in lyz+ neutrophils, mpeg1+ microglia and mpeg1+ peripheral macrophages from 3 dpf Tg(lyz:GFP) or Tg(mpeg1:DsRedx) embryos. Pooled from two separate experiments. n = 5 for each group in a single experiment. Values represent means with SD. (I) Quantitative RT-PCR of il34 expression in the brain rudiments of 3 dpf WT or Tg(Xla.Tubb:bcl-2) embryos. Pooled from three separate experiments. n = 20 for each single experiment. Values represent means with SD. ns, P>0.05; *, P ≤ 0.05 |
Reprinted from Developmental Cell, 46, Wu, S., Xue, R., Hassan, S., Nguyen, T.M.L., Wang, T., Pan, H., Xu, J., Liu, Q., Zhang, W., Wen, Z., Il34-Csf1r Pathway Regulates the Migration and Colonization of Microglial Precursors, 552-563.e4, Copyright (2018) with permission from Elsevier. Full text @ Dev. Cell