
- Title
-
A tRNA-based multiplex sgRNA expression system in zebrafish and its application to generation of transgenic albino fish
- Authors
- Shiraki, T., Kawakami, K.
- Source
- Full text @ Sci. Rep.

Generation of transgenic albino zebrafish by using tRNA-based multiplexed sgRNA expression. (A) Structure of DNA construct used for the generation of transgenic albino zebrafish. Three distinct sgRNAs targeting the albino (slc45a2) locus were cloned at the BseRI site of an all-in-one Tol2 vector, pT2TS-ubb:Cas9;u6c:Dr-tRNAGly(GCC)-sgRNA-scaffold, and are transcribed as a single polycistronic RNA under the zebrafish u6c promoter. Cas9 is driven by the ubb promoter, and its direction is opposite to that of the u6c:sgRNAs. (B) Representative images of the dorsal view of 3-dpf larvae derived from a founder fish (#11). Some larvae show severe albino phenotype (lower), whereas most larvae show normal pigmentation (upper). (C) The rate of F1 larvae showing albino phenotype at 3 dpf for each founder fish. Numbers in parentheses indicate the number of F1 larvae examined. (D) Transgenic ratio of F1 fish with albino phenotypes derived from two founders, F0#11 and F0#14. (E) Detection of mutations at multiple genomic sites of the slc45a2 locus in transgenic-albino larvae. (top) Genotyping of transgenic fish was performed by PCR using primers on SpCas9 genes. (middle three panels) Detection of mutations at multiple genomic sites of the slc45a2 locus by Heteroduplex mobility assay (HMA). Mutations were introduced in all the three targeting sites in a transgenic larva (lane#3) that showed severe albino phenotype. White asterisks on the HMA gel image of sg3 denote faint heteroduplex bands. (bottom) Bar charts show quantification of the ratio of the heteroduplex bands in sg1 and sg4. Data are shown as mean ± SEM (N = 3 for sever and mild, and N = 6 for normal). Dots represent data obtained from individual samples. Asterisks indicate significant differences (P < 0.05, Student’s t test). (F) Representative images of the lateral views of adult wild-type (WT; upper) and transgenic-albino (Tg; lower) fish. (G) Magnified images of the head region of the fish shown in F. (H) The rate and severity of the albino phenotype in F2 offspring at 3 dpf produced from four F1 fish derived from Tg#11. Numbers in parentheses indicate the number of F2 larvae examined. Scale bars: 500 µm (B), 5 mm (F), 1 mm (G). Full gels are shown in Supplementary Fig. S11. |
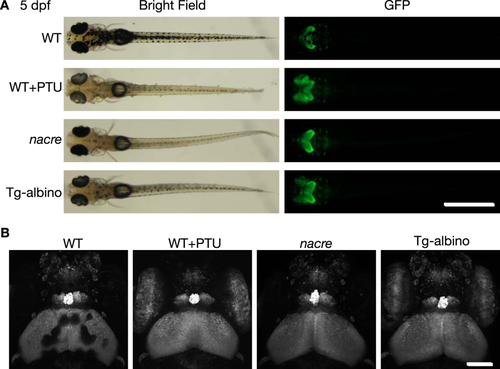
Fluorescent images of Gt(gSA2AzGFF49A);Tg(UAS:GFP) at 5 dpf in Tg-albino background. (A) Representative bright field (left) and fluorescent (GFP; right) images of dorsal views of Gt(gSA2AzGFF49A);Tg(UAS:GFP) in wild-type (WT), PTU-treated WT (WT + PTU), nacre, and Tg-albino backgrounds. (B) Two-photon imaging of head regions in Gt(gSA2AzGFF49A);Tg(UAS:GFP). Images are displayed as a maximum projection of z-stacks. Scale bars: 1 mm (A), 100 µm (B). |

Generation of transgenic albino (Tg-albino) zebrafish. (A) Representative images of the lateral views of 3-mpf F0 fish. (lower) Some fish show mosaic albino phenotype. (B) Representative images of the dorsal views (left) and lateral views (right) of 3-dpf F1 larvae derived from F0#11 (founder) fish. F1 larvae with normal pigmentation (top), mild albino phenotype (middle), and severe albino phenotype (bottom). (C) Representative images of the lateral views of adult wild-type (WT; upper) and transgenic (Tg; lower) fish. (D) Magnified images of the trunk region of the fish shown in D. Scale bars: 5 mm (A), 1 mm (B), 1 cm (C), 2 mm (D). |
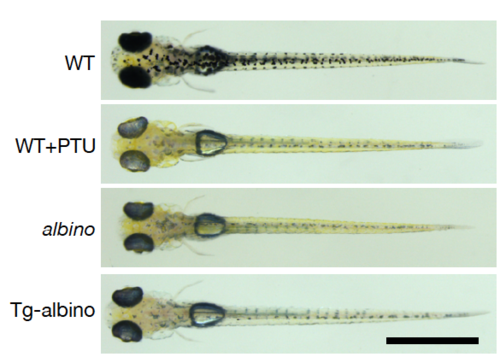
Eye and body pigmentation in Tg-albino at Day 5. Representative bright field images of dorsal views of wild-type (WT), PTU-treated WT (WT+PTU), albino, and Tg-albino backgrounds. Scale bars: 1 mm. |