
- Title
-
Injury of Adult Zebrafish Expressing Acvr1lQ204D Does Not Result in Heterotopic Ossification.
- Authors
- LaBonty, M., Pray, N., Yelick, P.C.
- Source
- Full text @ Zebrafish

rh activin A is detectable in zebrafish muscle tissue at 1 hpi. Before injection injury, adult zebrafish were anesthetized, and scales were gently removed from the right, dorsal side, just anterior to the dorsal fin (A). Zebrafish were injected at the descaled site with the indicated treatment using a microcapillary needle (B). To first test this model, adult Tg(Bre:GFP) zebrafish were injected with rh activin A (E: 5 × , H: 20 × ) or DMSO (D: 5 × , G: 20 × ), collected at 1 hpi, and analyzed for rh activin A expression by IHC. Act A was clearly detected at the Act A-injected injury site, and not in control DMSO or primary controls (C: 5 × , F: 20 × ). (F–H) Enlarged views of areas indicated by boxes in (C–E), respectively. n = 2 zebrafish per treatment group. (C–E) 5 × scale bar is 200 μm. (F–H) 20 × scale bar is 50 μm. Act A, activin A; DMSO, dimethyl sulfoxide; hpi, hours postinjury; IHC, immunohistochemistry; rh, recombinant human. |

rh activin A injection caused tissue damage apparent at 2 dpi that resolved by 4 wpi. Adult heat-shocked Tg(Bre:GFP) and Tg(Bre:GFP);Tg(HS-acvr1l_Q204D-mCherry) zebrafish were injected with rh Activin A (B, D, F, H, J, L) or DMSO (A, C, E, G, I, K), collected at 2 dpi (A–H) and 4 wpi (I–L), paraffin sectioned, and analyzed by H&E staining (A–E, I–L) and anti-pSmad2 IHC (E–H). At 2 dpi, tissue damage was apparent, as indicated by a dashed line(A–H). In contrast, no tissue damage was apparent at 4 wpi (I–L). n = 2 zebrafish per treatment group, per time point. The 5 × scale bar is 200 μm (A–H), and the 20 × scale bar is 100 μm. (I–L). dpi, days postinjury; wpi, weeks postinjury. PHENOTYPE:
|

CTX injection caused tissue damage apparent at 2 dpi that resolved by 4 wpi. Adult heat-shocked Tg(Bre:GFP) and Tg(Bre:GFP); Tg(HS-acvr1l_Q204D-mCherry) zebrafish injected with CTX (B, D, F, H, I–L) or PBS (A, C, E, G) were collected at 2 dpi (A–H) and 4 wpi (I–L). Paraffin sections of the lesion site were analyzed by H&E staining (A–D, I, J), Safranin O staining (K, L), and anti-pSmad2 IHC (E–H). Tissue damage is indicated by the dashed outline(A–H). The injury lesion and pSmad2 expression were apparent at 2 dpi (A–H), and not at 4 wpi (I–L). n = 1 zebrafish per PBS treatment group, n = 3 zebrafish per CTX treatment group at 2 dpi. n = 1 zebrafish per CTX treatment group at 4 wpi. (A–L) 5 × scale bar is 400 μm. CTX, cardiotoxin; PBS, phosphate-buffered saline. PHENOTYPE:
|
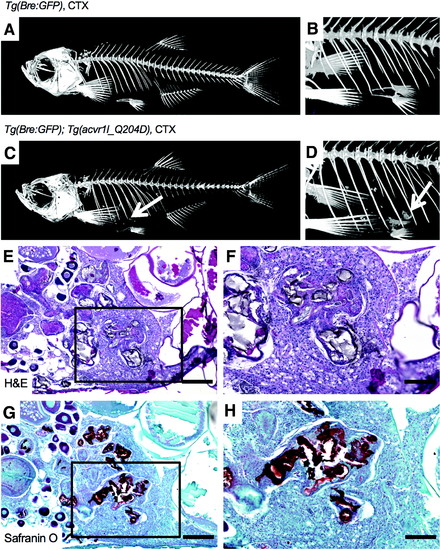
CTX -injected heat-shocked Tg(acvr1l_Q204D) zebrafish exhibited body cavity HO at 8 wpi. Micro-CT imaging of CTX-injected heat-shocked Tg(Bre:GFP); Tg(acvr1l_Q204D-mCherry) zebrafish (C, D) at 8 wpi revealed the presence of HO in the body cavity (arrows in C, D). Control CTX-injected heat-shocked Tg(Bre:GFP) zebrafish did not exhibit detectable HO (A, B). H&E (E, F) and Safranin O (G, H) staining of HO in heat-shocked Tg(Bre:GFP); Tg(acvr1l_Q204D-mCherry) zebrafish revealed heterogeneity of the HO lesion, including numerous proteoglycan-dense regions (G, H, strong red Safranin O stain). (F, H) Enlarged views boxed areas in (E, G), respectively. n = 3 Tg(Bre:GFP); Tg(acvr1l_Q204D-mCherry) zebrafish with CTX treatment. n = 1 Tg(Bre:GFP) zebrafish with CTX treatment. (E, G) 10 × scale bar is 200 μm. (F, H) 20 × scale bar is 100 μm. HO, heterotopic ossification; micro-CT, microcomputed tomography. PHENOTYPE:
|

Caudal fin clip did not result in HO formation at injury site in heat-shocked Tg(acvr1l_Q204D) zebrafish by 2 wpi. Caudal fin clip-injured adult heat-shocked Tg(Bre:GFP) and Tg(Bre:GFP); Tg(acvr1l_Q204D-mCherry) zebrafish were imaged with bright field microscopy before fin clip (A, B), immediately after fin clip (C, D), and at 1 wpi (E, F) and 2 wpi (G, H). The original site of the fin clip is marked by dashed line(E–H). Zebrafish were imaged by micro-CT (I, J) at 2 wpi before euthanization. n = 3 zebrafish per genotype. PHENOTYPE:
|

Caudal fin clip-injured heat-shocked Tg(acvr1l_Q204D) zebrafish exhibited spinal and body cavity HO at 2 wpi. Micro-CT image of tail fin clip-injured HS Tg(Bre:GFP); Tg(acvr1l_Q204D-mCherry) zebrafish (D–I) at 2 wpi revealed the presence of HO in the body cavity and along the spine (D–I, arrows). Control fin clip-injured HS Tg(Bre:GFP) zebrafish did not exhibit detectable HO (A–C). n = 3 Tg(Bre:GFP); Tg(acvr1l_Q204D-mCherry) zebrafish. n = 1 Tg(Bre:GFP) zebrafish. HS, heat shock. PHENOTYPE:
|
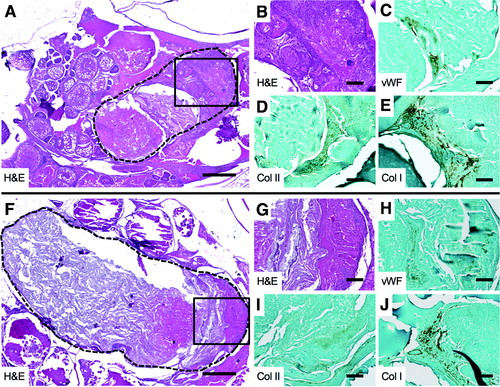
Cartilage and bone formation in body cavity HO in Acvr1lQ204D-expressing zebrafish. HO lesions in tail fin clip-injured HS Tg(Bre:GFP); Tg(acvr1l_Q204D-mCherry) zebrafish at 2 wpi, paraffin sectioned and H&E stained (A, B, F, G), and analyzed by IHC for vWF (C, H), Col II (D, I), and Col I (E, J). The HO lesion is outlined with a dashed line(A, F). (B, G) Enlarged views of boxed areas in (A, F), respectively. (A, F) 5 × scale bar is 40 μm. (B–E, G–J) 20 × scale bar is 100 μm. Col I, collagen I; Col II, collagen II; vWF, von Willebrand factor. PHENOTYPE:
|