
- Title
-
Maternal Ybx1 safeguards zebrafish oocyte maturation and maternal-to-zygotic transition by repressing global translation
- Authors
- Sun, J., Yan, L., Shen, W., Meng, A.
- Source
- Full text @ Development

Maternal ybx1 mutant embryos exhibit severe morphological defects. (A) Generation of the ybx1 mutant allele using CRISPR/Cas9. Top: the gRNA target site (red arrow) within the first exon (E1). Grey boxes, white boxes and connecting lines represent the open reading frame, untranslated regions and introns, respectively. Middle: sequences of ybx1 WT and ybx1tsu3d5i alleles near the gRNA target site (underlined) showing the deleted 3 bp (boxed) and the 5-bp insertion (red). Bottom: domains of Ybx1 WT protein and predicted mutant protein. APD, alanine/proline-rich domain; CSD, cold shock domain; CTD, C-terminal domain. (B,C) Loss of ybx1 mRNA in Mybx1 embryos revealed by qRT-PCR (B) and WISH (C). (D) Bright-field images showing the embryonic malformation of Mybx1 mutants in contrast to time-matched WT embryos. (E) Bright-field and fluorescent images of Mybx1 embryos expressing GFP-Ybx1. Mybx1; Tg(ef1α:GFP-ybx1) embryos were obtained by crossing Zybx1; Tg(ef1α:GFP-ybx1) females to WT males. Scale bars: 200 μm. |
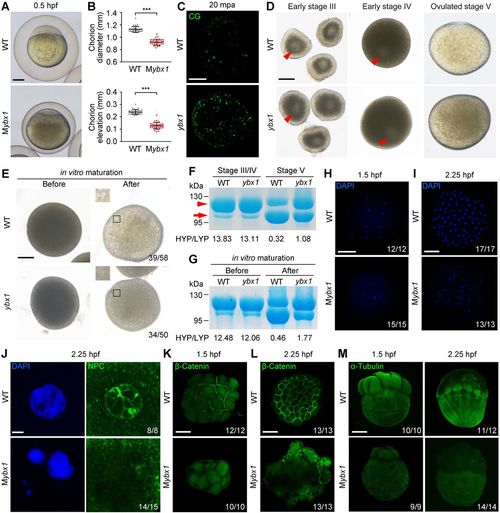
Characterization of Mybx1 mutant phenotype. (A) WT and Mybx1 embryos with chorions at 0.5 hpf. (B) Measurement of chorion diameters and chorion elevation distances at 0.5 hpf. ***P<0.001; n=33; Welch's t-test. (C) Representative images showing labelling of cortical granules (CG) in WT and ybx1 mutant eggs fixed at 20 min post-activation (mpa). Lateral views of eggs are shown. Eggs observed: WT n=23, mutant n=28. (D) Early stage-III oocytes, early stage-IV oocytes and ovulated stage-V eggs from WT and Zybx1 female fish. Arrowheads indicate germinal vesicles (oocyte nuclei) in the centre of stage-III oocytes and closer to the cortex in stage-IV oocytes. (E) WT and ybx1 mutant oocytes before and after in vitro maturation. Insets show enlarged regions of the yolk. Relative opaqueness is seen in ybx1 mutants. (F) SDS-PAGE and Coomassie staining of major yolk proteins of stage-III/IV oocytes and stage-V eggs. The higher and lower molecular weight yolk proteins (HYP and LYP) are indicated by the arrowhead and arrow, respectively. HYP/LYP ratios were calculated to represent yolk protein cleavage levels. (G) Major yolk protein cleavage in oocytes before and after in vitro maturation. Three independent experiments were performed for F and G. (H,I) Whole-mount DAPI staining of WT and Mybx1 embryos at 1.5 hpf (H) and 2.25 hpf (I) shown in animal pole views. (J) DAPI staining and NPC immunofluorescence in 2.25 hpf embryos. (K,L) β-Catenin membrane immunofluorescence in 1.5 hpf (K) and 2.25 hpf (L) embryos shown in animal pole views. (M) α-Tubulin immunofluorescence in 1.5 hpf and 2.25 hpf embryos shown in lateral views. Numbers of observations are indicated in H-M. H shows inverted fluorescence microscopic images. I,K,M show maximum intensity projections of confocal z-slices. J and L show individual confocal planes. Scale bars: 200 μm in A,C-E,H,I,K-M; 5 μm in J. |
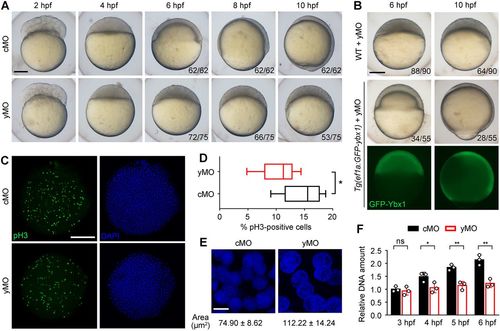
Postfertilization production of Ybx1 is required for embryonic cell proliferation and epiboly initiation. (A) Bright-field images of embryos injected with cMO or yMO. Some yMO-injected embryos underwent yolk collapse and died, thus reducing the number of embryos with the representative phenotypes from 6 hpf to 10 hpf. (B) yMO-injected WT and Tg(ef1α:GFP-ybx1) embryos. Fluorescent images show the GFP-ybx1 transgene expression driven by zebrafish ef1α promoter. (C) Labelling of pH3-positive cells in MO-injected embryos fixed at 4 hpf, with the quantification displayed by box-and-whisker plots in D. *P<0.05; n=9 regions of interest from three embryos; Student's t-test. (E) Confocal z-projections of DAPI staining. Measurement of the nucleus area is presented as mean±s.d. (n=20 nuclei). (F) Quantification of extracted genomic DNAs from equal numbers of cMO or yMO-injected embryos. Each circle represents the value of a sample containing ten embryos. ns, not significant; *P<0.05, **P<0.01; n=3; Student's t-test. Scale bars: 200 μm in A-C; 10 μm in E. |

ZFIN is incorporating published figure images and captions as part of an ongoing project. Figures from some publications have not yet been curated, or are not available for display because of copyright restrictions. |

Loss of maternal Ybx1 elevates global translation level. (A) Schematic of the fluorescent reporter translation assay. (B,C) Fluorescent images showing GFP reporter levels with rhodamine (Rho) control levels in WT, Mybx1, cMO- and yMO-injected live embryos at indicated stages. Scale bar: 200 μm. (D) Measurement of GFP reporter intensities relative to Rho. (E) Schematic of reporter translation assays using western blotting and luciferase assay. (F) Western blotting analysis of GFP reporter levels at 6 hpf. (G) Measurement of Fluc activities relative to Rluc. (H) SDS-PAGE and silver staining showing global protein levels in embryos. Three regions for measurement are indicated. 3 hpf embryos were lysed for the SDS-PAGE. GFP protein was injected at the one-cell stage as the loading control. (I) Quantification of relative signal intensities of three regions from H. (J) Western blot for the puromycin incorporation assay. GFP protein was injected as the loading control. Gapdh levels are also shown. Un, untreated; Puro, puromycin; CHX, cycloheximide. (K) Puromycin incorporation levels in WT and Mybx1 embryos shown by western blotting. The injected GFP protein served as the loading control. (L) Relative puromycin signal intensities of three regions from western blots in K. *P<0.05, **P<0.01, ***P<0.001; ns, not significant; n=8 embryos for D, n=3 biological replicates for F,G,I,L; Student's t-test. |
|
ZFIN is incorporating published figure images and captions as part of an ongoing project. Figures from some publications have not yet been curated, or are not available for display because of copyright restrictions. |

Translational inhibition ameliorates the Mybx1 phenotype. (A) Western blot of Ybx1, GFP-Eif4ebp1-TTAA and Gapdh protein expression in WT, Mybx1 and Mybx1+TTAA embryos. (B) Bright-field images showing representative Mybx1 and Mybx1+TTAA embryos with chorions after fertilization. (C) Chorion elevations of individual 0.5 hpf fertilized eggs from a single Zybx1 or Zybx1+TTAA female. Each dot or circle represents one egg's value. ***P<0.001; Welch's t-test. (D) Average chorion elevations of fertilized eggs from different females. Six females of each group, 50-100 eggs per female, were analyzed. Each circle represents the average of all observed eggs from a single female. *P<0.05; Welch's t-test. (E) Coomassie staining of major yolk proteins of ybx1 mutant and ybx1+TTAA stage-V eggs. HYP/LYP ratios were calculated to display yolk protein cleavage levels. (F) Major yolk protein cleavage in oocytes before and after in vitro maturation. (G) Bright-field images of Mybx1 and Mybx1+TTAA gastrulas. (H) The percentage of epiboly restored Mybx1+TTAA embryos from different females. Epiboly initiation is extremely rare in Mybx1 mutants. *P<0.05; n=6; Welch's t-test. (I,J) qRT-PCR detection of partially restored maternal mRNA clearance (I) and zygotic gene transcription (J) in Mybx1+TTAA embryos, compared with Mybx1 mutants. WT results are also presented. *P<0.05, **P<0.01; n=3; Student's t-test. Scale bars: 200 μm. |
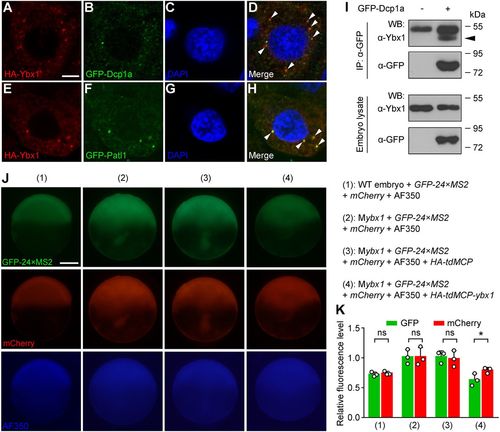
Ybx1 is localized in P-body-like granules in embryos and represses the translation of bound mRNA. (A-H) Colocalization of HA-Ybx1 with the GFP-labelled P-body components Dcp1a (A-D) and Patl1 (E-H) in 4 hpf embryos. HA immunofluorescence (A,E), GFP immunofluorescence (B,F), DAPI staining (C,G) and merged signals (D,H) are shown in confocal slices. Arrowheads indicate colocalization foci. Scale bar: 5 μm. (I) Association of endogenous Ybx1 with GFP-Dcp1a in embryos revealed by co-IP. Embryos were injected with gfp-dcp1a mRNA at the one-cell stage and harvested at 8 hpf. IP, immunoprecipitation; WB, western blot. The arrowhead indicates the band of immunoprecipitated endogenous Ybx1 protein. (J) Fluorescent images showing the levels of GFP-24×MS2, mCherry and AF350 dye (loading control). Embryo genotypes and injected reagents are listed on the right. Scale bar: 200 μm. (K) Measurement of GFP and mCherry fluorescence levels relative to AF350. Both GFP and mCherry levels are upregulated in 2 and 3 compared with 1. Note the marked decrease of GFP intensity and the lesser decrease of mCherry in 4 compared with 3. ns, not significant; *P<0.05; n=3 embryos; Student's t-test. |

Ovaries and oocytes from WT and Zybx1 females. (A) Ovaries from WT and Zybx1 females at 10 dpp. Mature eggs were purged from female fish via natural matings on Day 1. On Day 11 (10 dpp), female fish were sacrificed. (B) Total oocytes from WT and Zybx1 female fish at 10 dpp. Scale bars: 1 mm. |
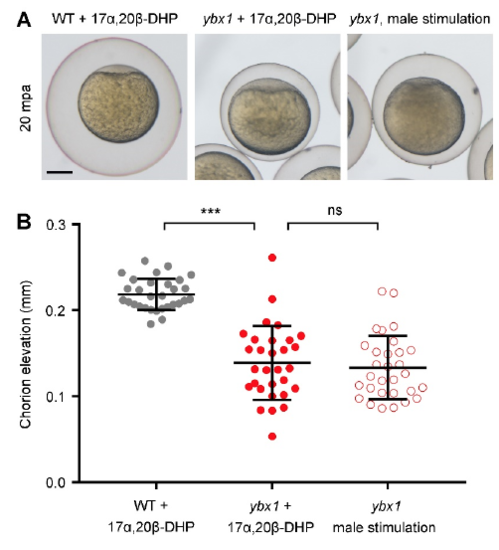
Hormonal stimulation cannot rescue the egg activation defect caused by Ybx1 depletion. (A) Representative images of activated eggs with chorions. Eggs from 17α,20β-DHP-treated WT female fish, 17α,20β-DHPtreated Zybx1 female fish and male fish-stimulated Zybx1 female fish are shown from left to right. mpa, minutes post-activation. Chorion expansion after water activation was used as the criterion for evaluating oocyte maturation and egg activation. (B) Measurement of chorion elevation distances at 20 mpa. ns, not significant; ***P<0.001; Welch’s t-test. |
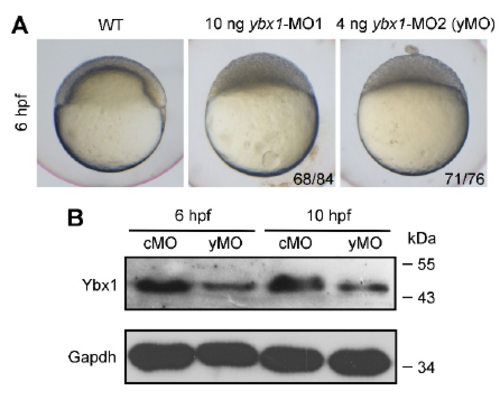
Knockdown of ybx1 expression by translation-blocking morpholinos. (A) Bright-field images of a WT embryo and embryos injected with 10 ng ybx1-MO1 or 4 ng ybx1-MO2. 4 ng ybx1-MO2 was injected in subsequently described experiments as yMO. (B) Examination of yMOmediated ybx1 knockdown efficiency. Endogenous Ybx1 and Gapdh were detected by western blotting. |

GFP-Ybx1 expression in oocytes. Expression of GFP-Ybx1 fusion protein in Tg(ef1α:GFP-ybx1) oocytes at stage II (A,B) and early stage III (C,D). (A,B) Bright-field images. (C,D) Fluorescent images. Red arrowheads indicate oocyte nuclei. Scale bar: 100 μm. |

The transgenic zebrafish line expressing a CA form of Eif4ebp1. (A) A diagram of the zebrafish ef1α promoter-driven gfp-eif4ebp1-TTAA transgene. (B) Bright-field and fluorescent images of Tg(ef1α:gfp-eif4ebp1- TTAA) embryos at 6 hpf, 10.5 hpf and 26 hpf, showing expression of Eif4ebp1- TTAA and the resulted developmental delay. |