
- Title
-
Modeling Niemann-Pick disease type C1 in zebrafish: a robust platform for in vivo screening of candidate therapeutic compounds.
- Authors
- Tseng, W.C., Loeb, H.E., Pei, W., Tsai-Morris, C.H., Xu, L., Cluzeau, C.V., Wassif, C.A., Feldman, B., Burgess, S.M., Pavan, W.J., Porter, F.D.
- Source
- Full text @ Dis. Model. Mech.
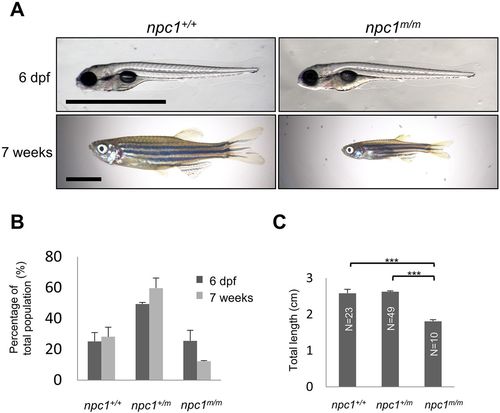
npc1 mutant zebrafish morphology and survival. (A) Photographs of representative wild-type and npc1m/m at 6 dpf and 7 weeks of age. No dysmorphology was noted at 6 dpf. Marked growth retardation was apparent at 7 weeks of age. Scale bars: 1 mm (6 dpf) and 5 mm (7 weeks). (B) Genotype distribution from the intercross of npc1+/m zebrafish at 6 dpf (n=166) and 7 weeks (n=82) of age. (C) Total length of npc1+/+, npc1+/m and npc1m/m zebrafish at 7 weeks of age. ***P<0.001 by two-tailed t-test. PHENOTYPE:
|
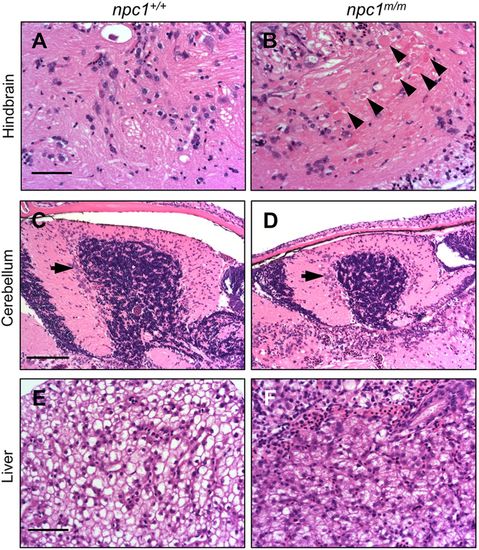
Histopathology of adult npc1m/m liver and brain tissue. (A,B) Photographs of Hematoxylin and Eosin (H&E)-stained hindbrain tissue sections from adult npc1+/+ (A) and npc1m/m (B) zebrafish at 9 weeks of age. Axonal spheroids are indicated by the arrowheads. Scale bar: 50 μm. (C,D) H&E-stained cerebellar sections from 9-week npc1+/+ (C) and npc1m/m (D) zebrafish. The arrows indicate cerebellar Purkinje neurons. Scale bar: 100 μm. (E,F) H&E-stained liver sections from 9-week npc1+/+ (E) and npc1m/m (F) zebrafish. Scale bar: 50 μm. PHENOTYPE:
|
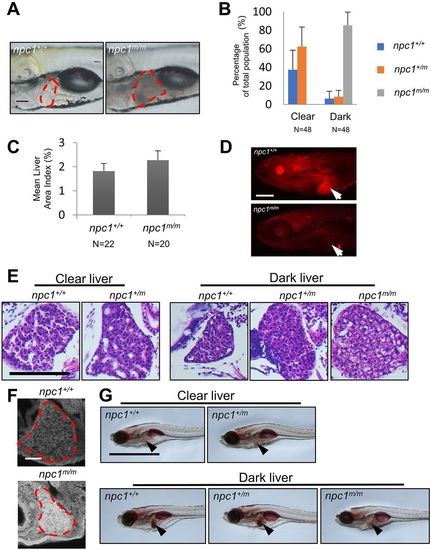
Liver pathology in npc1m/m larvae. (A) Lateral live images of npc1+/+ and npc1m/m 7 dpf larvae. The area corresponding to liver is outlined by the red dashed line. Scale bar: 100 μm. (B) 7 dpf zebrafish larvae were separated by liver phenotype (clear versus dark) and then genotyped. A small proportion of npc1+/+ or npc1+/m larvae had a dark liver phenotype. In contrast, all npc1m/m larvae had the dark liver phenotype. (C) Liver size was quantified by measuring the lateral view area corresponding to the liver tissue and normalized to the total lateral body projection area (area index) in 7 dpf larvae. Liver size was significantly (P<0.001, two-tailed t-test) increased in npc1m/m larvae compared to npc1+/+ control larvae. (D) Immunofluorescence images of 7 dpf wild-type and npc1m/m stained with anti-NPC1 antibody. Arrows point to the liver. NPC1 staining is absent in the npc1m/m liver tissue. Scale bar: 200 μm. (E) H&E staining of liver tissue from 7 dpf npc1+/+ and npc1+/− larvae with the clear liver phenotype, and npc1+/+, npc1+/m and npc1m/m larvae with the dark liver phenotype. Scale bar: 50 μm. (F) Filipin staining of 7 dpf npc1+/+ and npc1m/m larvae. Liver tissue is outlined. Scale bar: 50 μm. (G) Oil Red O staining of 7 dpf larvae sorted with respect to clear/dark liver phenotype and genotype. Arrowheads point to the liver. Scale bar: 1 mm. |
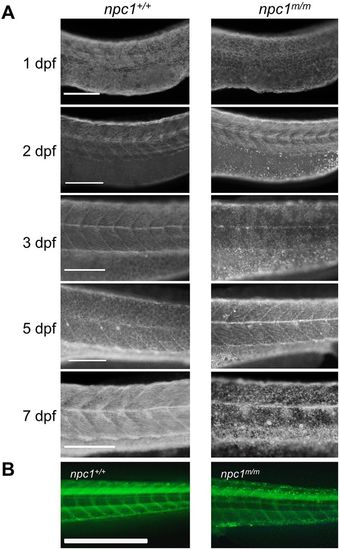
Unesterified cholesterol accumulation. (A) Control and mutant larvae were stained with filipin to visualize unesterified cholesterol. Filipin-positive puncta were initially observed in mutant larvae at 2 dpf in the area of the yolk sac extension and became more numerous with a wider distribution in older larvae. Scale bars: 200 µm. (B) Embryos were injected with TopFluor-cholesterol at the 1-cell stage and imaged at 7 dpf. Puncta of accumulated cholesterol were observed in the npc1m/m larvae. Scale bar: 1 mm. |
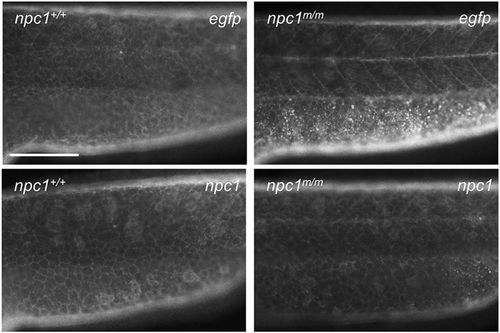
Yolk syncytial layer accumulation of unesterified cholesterol. Plasmids expressing either EGFP or npc1 were injected into the yolk syncytial layer (YSL) of 3.5 hpf embryos. Filipin staining of 2 dpf embryos demonstrated reversal of unesterified cholesterol accumulation in the YSL of mutant larvae expressing npc1. Scale bar: 200 μm. PHENOTYPE:
|
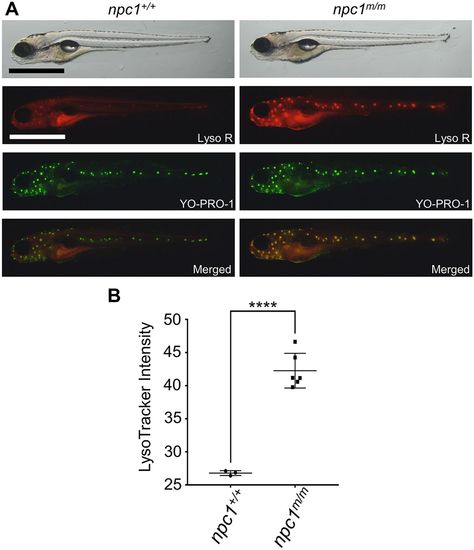
Intense LysoTracker staining in npc1m/m lateral line neuromasts. (A) Vital staining of 5 dpf npc1+/+ and npc1m/m larvae stained with LysoTracker Red and YO-PRO-1. The merged image localizes the intense LysoTracker Red staining of acidic organelles to the YO-PRO-1-positive neuromasts. Scale bar: 1 mm. (B) Mean LysoTracker intensity of lateral line neuromasts was quantified from multiple individuals. Note that LysoTracker relative intensity of lateral line neuromasts was significantly increased in npc1m/m larvae at 5 dpf (npc1+/+: n=3; npc1m/m: n=6). ****P<0.0001 by two-tailed t-test. PHENOTYPE:
|
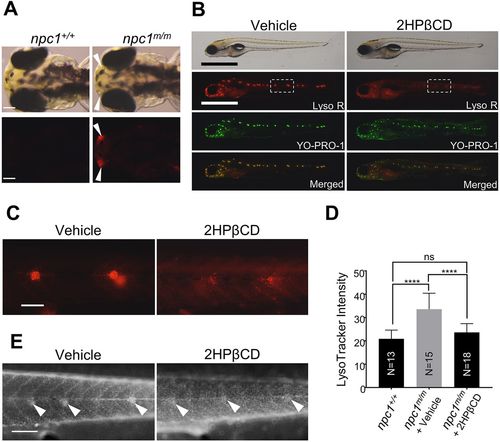
2HPβCD treatment reduces LysoTracker Red and filipin staining in npc1m/m neuromasts. (A) Control and mutant larvae can be differentiated at 3 dpf by intense LysoTracker Red (Lyso R) staining of the olfactory placode (arrowheads) at 3 dpf. Scale bars: 100 μm. (B) Mutant larvae selected by Lyso-R-positive olfactory placode staining were treated for 3 days with vehicle (ddH2O) or 2.5 mM 2HPβCD starting at 3 dpf. Neuromast Lyso R staining was markedly decreased in 2HPβCD-treated npc1m/m larvae. Scale bars: 1 mm. (C) Higher magnification view of Lyso R staining, corresponding to the boxed area in B. Scale bar: 100 μm. (D) Lyso R relative intensity was significantly reduced in npc1m/m larvae treated with 2.5 mM 2HPβCD at 6 dpf. ****P<0.0001; ns, not significant. Significance was calculated by two-tailed t-test. (E) Filipin staining confirmed decreased unesterified cholesterol accumulation in neuromast (arrowheads) of npc1m/m larvae treated with 2.5 mM 2HPβCD. Scale bar: 200 μm. PHENOTYPE:
|

ZFIN is incorporating published figure images and captions as part of an ongoing project. Figures from some publications have not yet been curated, or are not available for display because of copyright restrictions. EXPRESSION / LABELING:
PHENOTYPE:
|
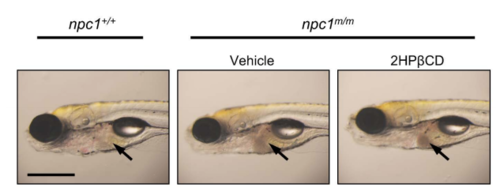
2HPβCD treatment and Liver defect. Lateral live image of npc1+/+ and npc1m/m larvae at 7 dpf with or without 2HPβCD treatment (from 3 to 6 dpf). Arrows: liver. Scale bar = 500 μm. PHENOTYPE:
|
|
Unillustrated author statements |