
- Title
-
Pitpnc1a Regulates Zebrafish Sleep and Wake Behavior through Modulation of Insulin-like Growth Factor Signaling
- Authors
- Ashlin, T.G., Blunsom, N.J., Ghosh, M., Cockcroft, S., Rihel, J.
- Source
- Full text @ Cell Rep.
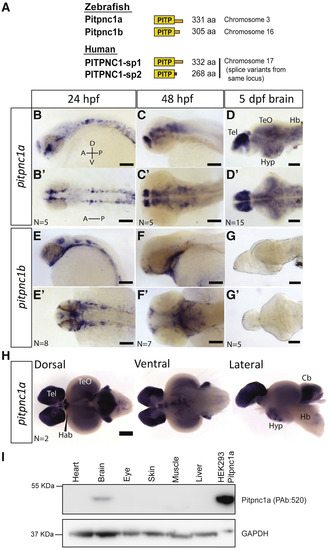
One Zebrafish PITPNC1 Ortholog Is Exclusively Expressed in the Brain (A) Zebrafish PITPNC1 orthologs and human splice variants. (B–D′) pitpnc1a mRNA is detected in the nervous system at 24 hpf (B and B′), 48 hpf (C and C′), and is widespread in the brain by 5 dpf (D and D′). (E–G′) pitpnc1b mRNA is expressed in non-neuronal tissue, including the pharyngeal arches and olfactory pits (E–F′). pitpnc1b mRNA is undetectable in the larval brain (G and G′). (H) pitpnc1a mRNA is expressed in many areas of the adult zebrafish brain. (I) Pitpnc1a protein is detected only in the adult zebrafish brain. Transfected HEK293 cells are a positive control. Tel, telencephalon; TeO, optic tectum; Hyp, hypothalamus; Hb, hindbrain; Hab, habenula; Cb, cerebellum. Scale bars, 100 μm (B–G′) and 500 μm (H). |
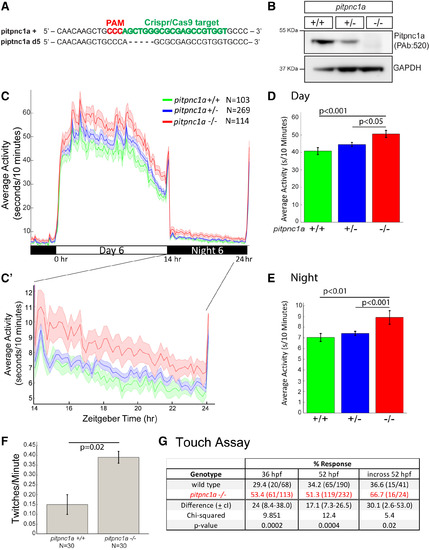
pitpnc1a -/- Larvae Are Behaviorally Hyperactive (A) CRISPR/Cas9 generated a 5-base pair deletion in exon 2 of pitpnc1a. (B) Pitpnc1a protein is detected in pitpnc1a+/+ brain lysates, weaker in pitpnc1a+/-, and undetectable in pitpnc1a-/-. (C) An activity plot across a 14:10 hr day-night cycle (zoomed in C′) reveals hyperactivity in 6 dpf pitpnc1a-/-. The shaded ribbons represent ± SEM. (D and E) Bar plots (±SEM) of the mean day (D) and night (E) activity. pitpnc1a-/- animals are significantly more active during both day and night (one-way ANOVA, Tukey’s post hoc test). (F) At 36 hpf, pitpnc1a-/- embryos twitch significantly more than pitpnc1a+/+ (mean ± SEM, one-way ANOVA). (G) At both 36 and 52 hpf, pitpnc1a-/- embryos are significantly more touch sensitive (pooled data from 5 and 4 independent experiments, respectively, and repeated in a blinded pitpnc1a+/- in-cross; chi-square test). |
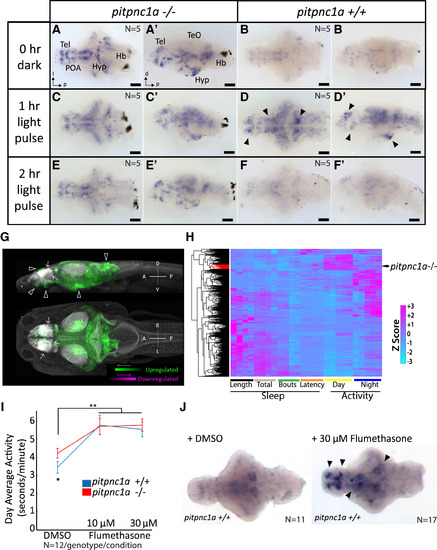
pitpnc1a−/− Brains Have Increased Neuronal Activity (A–B′) ISH reveals many areas of c-fos expression in 6 dpf pitpnc1a−/− larval brains (A and A′) compared with wild-type (B and B′). (C–D′) Following a 1 hr light pulse, additional neurons express c-fos in pitpnc1a−/− (C and C′) and wild-type (D and D′). Many areas expressing c-fos in wild-type after a light pulse overlap with strong c-fos signals in pitpnc1a−/− brains at 0 hr (black arrowheads, D and D′). (E–F′) After 2 hr of light, c-fos levels remain elevated in pitpnc1a−/− brains (E and E′) but have returned to baseline in wild-type (F and F′). (G) pERK/tERK comparison of dark-reared, 6 dpf pitpnc1a−/− (n = 15) and wild-type (n = 12) brains reveals mutant brain areas with upregulated (green) and downregulated (magenta) expression of pERK relative to controls. White arrowheads indicate areas of agreement between pERK and c-fos expression, and white arrows show the downregulated signal. Data are shown as a thresholded maximum projection overlaid on a maximum projection of the Z-Brain tERK reference (gray). (H) Clustering the behavioral fingerprint of pitpnc1a−/− against 550 drug-induced behavioral profiles places the phenotype in a strong day-active and modestly night-active cluster (red branches). (I) Flumethasone increases the behavioral activity of both wild-type and pitpnc1a−/− to the same level. DMSO-treated pitpnc1a−/− animals are hyperactive (∗p < 0.05, one-way ANOVA, Tukey’s post hoc test). Both 10 and 30 μM flumethasone increase larval activity (∗∗p < 0.01, two-way ANOVA, gene × dose, Tukey’s post hoc test). (J) Flumethasone induces c-fos expression in areas similar to pitpnc1a−/− and light pulses (black arrows). Hb, hindbrain; POA, preoptic area. (A–F) Dorsal view. (A′–F′) Lateral view. (J) Ventral view. Scale bars, 100 μm. EXPRESSION / LABELING:
PHENOTYPE:
|
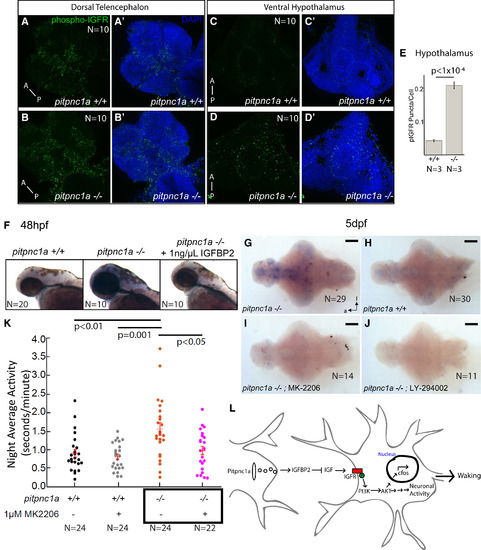
IGFR Signaling Is Enhanced in pitpnc1a−/− Brains, and Inhibiting IGFR Signaling Rescues Neuronal and Behavioral Hyperactivity (A–E) 6 dpf pitpnc1a−/− larvae have increased pIGFR puncta in the brain. (A–B′) Confocal projections of the dorsal telencephalon in wild-type (A and A′) and pitpnc1a−/− (B and B′) reveal pIGFR puncta (green). Nuclei are DAPI stained (blue) in (A′) and (B′). Confocal projections of the pitpnc1a−/− ventral hypothalamus (D and D′) have more pIGFR puncta (C and C′), as quantified in (E) (mean ± SEM, one-way ANOVA). (F) Upregulated c-fos in pitpnc1a−/− embryos is reduced to wild-type by soaking in 1 ng/μL IGFBP2 from 36 to 48 hpf. (G–J) ISH for c-fos in 6 dpf brains in constant dark after overnight exposure to PI3K (LY-294002, 2 μM) or Akt (MK-2206, 100 nM) inhibitors. (G and H) c-fos is upregulated in pitpnc1a−/− brains (G) relative to WT controls (H). (I and J) Akt (I) and PI3K (J) inhibitors reduce mutant c-fos expression to wild-type levels. Brains in (G)–(J) are overdeveloped to expose even weak c-fos expression. (K) Exposure to 1 μM Akt inhibitor, MK-2206, reduces average night-time activity of 6 dpf pitpnc1a−/− larvae to wild-type levels. Each dot represents a single larva, and the crossbars plot the mean ± SEM (two-way ANOVA, genotype × drug interaction, Tukey’s post hoc test). (L) Model of Pitpnc1a modulation of neuronal activity via IGFBP2 and inhibition of IGF-PI3K-Akt. Loss of Pitpnc1a enhances IGF signaling, leading to increased waking behavior. (G–J) Ventral view; scale bars, 100 μm. (A–B′) Scale bars, 100 μm. (C–E′) Scale bars, 20 μm. |
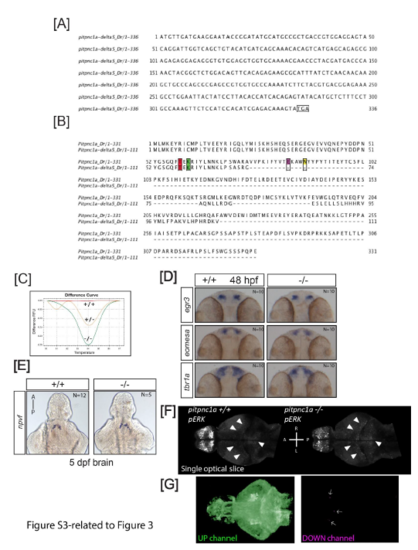
A CRISPR/Cas9 generated five base deletion of zebrafish pitpnc1a leads to a truncated protein lacking key functional residues, related to Figure 3. A) The pitpnc1a Δ5 allele leads to a truncated 336 bp open reading frame. B) Alignment of the full length Pitpnc1a and predicted truncated protein of the pitpnc1a Δ5 allele. Critical amino acids for binding of the inositol ring of phosphatidylinositol (T59, K61, E86, and N90, mouse numbering) are highlighted, demonstrating the truncated protein lacks two of these critical residues. C) DNA extracted from whole larvae and subjected to high resolution melt curve analysis (HRMA) is able to distinguish the wild type (+/+, red), heterozygous (+/-, yellow), and homozygous mutant (-/-, green) pitpnc1a genotypes. D) In situ hybridization revealed the expression of the dorsal forebrain markers egr3, eomesa, and tbr1a are unaffected in pitpnc1a-/- animals. Dorsal views; anterior to the top. E) In situ hybridization for an anterior hypothalamic marker, npvf, is unaffected in pitpnc1a-/- animals. Ventral views; anterior to the top. F) Representative optical pERK slices (plane 88 of the Z-brain) from wild type and mutant brains stained with pERK/tERK and linearly registered to the Z-Brain reference using the tERK channel. White arrowheads point to examples of areas with upregulated pERK in mutant brains. Images were normalized for intensity using the Stack Normalizer plugin https://imagej.nih.gov/ij/plugins/normalizer.html in Fiji. G) Single channels for the unthresholded maximum projections for the mutant upregulated (green, left) and downregulated (magenta, right) pERK signals. |
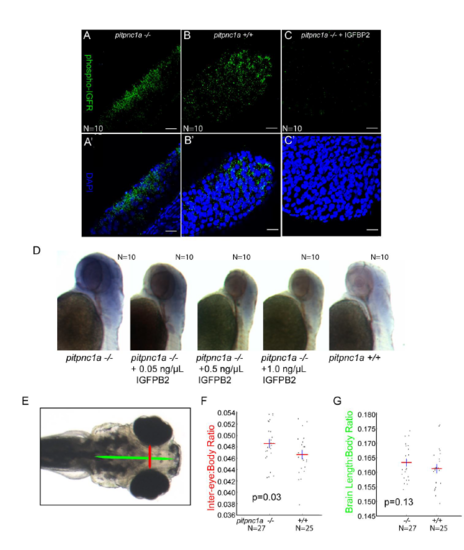
IGFBP2 dampens IGF signaling in zebrafish larvae, related to Figure 4. (A-C’) Confocal images of 48 hpf tailfins labeled with anti-pIGFR antibody (green) reveals numerous puncta in both pitpnc1a -/- (B, B’) and pitpnc1a +/+ (C, C’) embryos, which are nearly eliminated after soaking in 1 ng/μL IGFBP2 (C, C’). D) IGFBP2 dose-dependently reduces brain c-fos levels and reduces growth in pitpnc1a -/- embryos. E-G) pitpnc1a -/- animals have slightly larger brains than pitpnc1a+/+ larvae. E) Inter-ocular distance (red line) and brain length (green) were measured relative to total body length (not shown). F) Mutant brains are significantly (4.2%) larger than wild type (p=0.03, one-tailed t-test) as measured by interocular distance G) and trending (1.3%) larger by length (p=0.13, one-tailed t-test). Scale bars, A-C’, 20 μm. |