
- Title
-
Expression patterns of dscam and sdk gene paralogs in developing zebrafish retina.
- Authors
- Galicia, C.A., Sukeena, J.M., Stenkamp, D.L., Fuerst, P.G.
- Source

Expression of dscam genes in developing zebrafish retina. In situ hybridization using cryosections derived from 48, 72 and 96 hpf zebrafish retina is shown for A–C) dscama, D–F) dscamb, and G–I) dscaml1. Consistent labeling for all dscam genes was found in the INL and GCL (arrows in all panels); however, strong expression in the ONL was observed for dscamb (arrowheads in F versus C). D–F: Expression in the CMZ was also observed for (A) dscama at 48 hpf, (F) dscamb at 96 hpf, and (H; asterisk) dscaml1 at 72 hpf. All images displayed are of sections processed with antisense probe. Abbreviations: hpf=hours post fertilization; Dscam=Down syndrome cell adhesion molecule; INL=inner nuclear layer; GCL=ganglion cell layer; IPL=inner plexiform layer; CMZ=ciliary marginal zone (asterisk). Scale bar in A=50 μm (applies to all). |
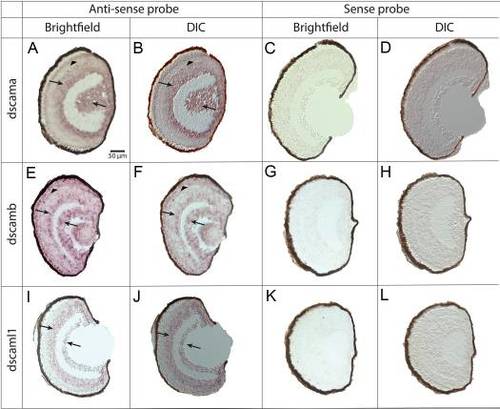
Bright-field and DIC imaging of antisense and sense in situ hybridization for dscam genes in cryosections. In situ hybridization using cryosections derived from 96 hpf zebrafish retina is shown for A-D) dscama, E-H) dscamb, and C) dscaml1. A,B,E,F,I,J) In situ hybridization performed with antisense probes is shown. Arrows point to labeling in the INL and ganglion cell layer (GCL); arrows point to labeling in the outer nuclear layer (ONL); and asterisks show labeling in the ciliary marginal zone (CMZ). C,D,G,H,K,L) In situ hybridization performed with sense probes is shown. A,C,E,G,I,K) Photographs of antisense and sense in situ hybridization taken under bright-field conditions are shown. B,D,F,H,J,L) Images of antisense and sense in situ hybridization collected using DIC microscopy are shown. Abbreviations: DIC=differential interference contrast; hpf=hours post fertilization; Dscam=Down syndrome cell adhesion molecule; Sdk=sidekick. Scale bar in A=50 μm (applies to all). EXPRESSION / LABELING:
|
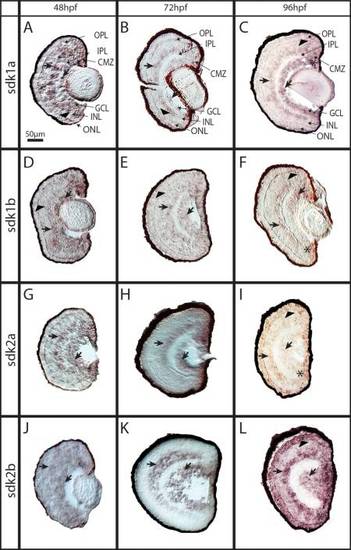
Expression of sdk genes in developing zebrafish retina. In situ hybridization using cryosections of 48, 72 and 96 hpf zebrafish retina is shown for A–C) sdk1a, D–F) sdk1b, G–I) sdk2a, and J–L) sdk2b. Consistent labeling for all sdk genes was found in the INL, the GCL (arrows in all panels), and the CMZ (asterisks); however, strong expression in the ONL was observed only for (I) sdk2a, and (L) sdk2b at 96 (arrows, compare L, I to C–F). All images displayed are of sections processed with antisense probe. Abbreviations: hpf=hours post fertilization; Sdk=sidekick; ONL=outer nuclear layer; INL=inner nuclear layer; GCL=ganglion cell layer; CMZ=ciliary marginal zone. Scale bar in A=50 μm (applies to all). |

Bright-field and DIC imaging of antisense and sense in situ hybridization for sdk genes in cryosections. In situ hybridization using cryosections derived from 96 hpf zebrafish retina is shown for A-D) sdk1a, E-H) sdk1b, I-L) sdk2a, and M-P) sdk2b. A,B,E,F,I,J,M,N) In situ hybridization performed with antisense probes is shown. Arrows point to labeling in the inner nuclear layer (INL) and the ganglion cell layer (GCL); arrows point to labeling in the outer nuclear layer (ONL); asterisks show labeling in the ciliary marginal zone (CMZ). C,D,G,H,K,L,O,P) In situ hybridization performed with sense probes is shown. A,C,E,G,I,K,M,O) Photographs of antisense and sense in situ hybridization taken under bright-field conditions are shown. B,D,F,H,J,L,N,P) Photographs of antisense and sense in situ hybridization taken using DIC microscopy are shown. Abbreviations: DIC=differential interference contrast; hpf=hours post fertilization; Dscam=Down syndrome cell adhesion molecule; Sdk=sidekick. Scale bar in A=50 μm (applies to all). EXPRESSION / LABELING:
|

Expression of dscam and sdk paralogs in developing zebrafish central retina at 96 hpf. Comparative expression patterns of dscama versus dscamb, sdk1a versus sdk1b, and sdk2a versus sdk2b are shown following dual in situ hybridization. A: Expression of dscama was observed in the GCL and in the INL, but no expression was observed in the ONL (arrows). B: Expression of dscamb was observed in the GCL, INL, and ONL (arrows). C: Gene paralogs, dscama, and dscamb are co-expressed in some cells within the INL and GCL (boxed region), but only dscamb is expressed in the ONL (arrows). Yellow arrows point to the outer plexiform layer for viewer orientation. D: Expression of sdk1a was observed in the GCL and INL. E: Expression of sdk1b was seen in the GCL and INL. F: Gene paralogs sdk1a and sdk1b were co-expressed in some cells within the GCL and INL (boxed region). G: Expression of sdk2b was observed in the GCL and INL. H: Expression of sdk2a was observed in the GCL and INL. I: Gene paralogs sdk2a and sdk2b were co-expressed in some cells within the INL and GCL (boxed region). Dashed boxes show the identical region of interest (ROI) in each row. The red boxes correspond to the ROI for panels showing single-label expression in A, B, D, E, G, and H. White boxes in C, F, and I show ROIs of co-expression of paralogs. Abbreviations: hpf=hours post fertilization; Dscam=Down syndrome cell adhesion molecule; Sdk=sidekick; ONL=outer nuclear layer; INL=inner nuclear layer; GCL=ganglion cell layer. Scale bar in A=20 μm (applies to all). EXPRESSION / LABELING:
|

Comparative expression of dscam and sdk genes in the central inner retina of developing zebrafish at 96 hpf. Dual in situ hybridizations show comparative expression domains of CAM genes. A) dscama and B) dscaml1. C: Merged image reveals some co-expression within the INL (boxed region). D: sdk1b is expressed in a subset of cells within the basal INL. E: dscamb was also observed in the basal INL. F: The merged image shows some overlap in expression (boxed region). G: sdk2b expression was observed within the INL (boxed region). H: dscamb transcripts were also observed in the INL, and I: merging the two reveals low levels of co-expression (boxed region). J: sdk2b is expressed in a subset of cells within the INL. K: sdk1b expression is also observed in cells in the INL. L: The merged image reveals that some overlap exists between cells positive for both. For all comparisons, we observed a mosaic of cells expressing the two targeted transcripts—some cells that express both transcripts and other cells that express only one or the other. Dashed boxes show the identical region of interest (ROI) in each row. The red boxes correspond to the ROI for panels showing single-label expression in A, B, D, E, G, H, J, and K. White boxes in C, F, I, and L show ROIs of co-expression of paralogs. Abbreviations: hpf=hours post fertilization; Dscam=Down syndrome cell adhesion molecule; Sdk=sidekick; INL=inner nuclear layer; GCL=ganglion cell layer. Scale bar in A=20 μm (applies to all). EXPRESSION / LABELING:
|