
- Title
-
Cancer modeling by Transgene Electroporation in Adult Zebrafish (TEAZ)
- Authors
- Callahan, S.J., Tepan, S., Zhang, Y.M., Lindsay, H., Burger, A., Campbell, N.R., Kim, I.S., Hollmann, T.J., Studer, L., Mosimann, C., White, R.M.
- Source
- Full text @ Dis. Model. Mech.
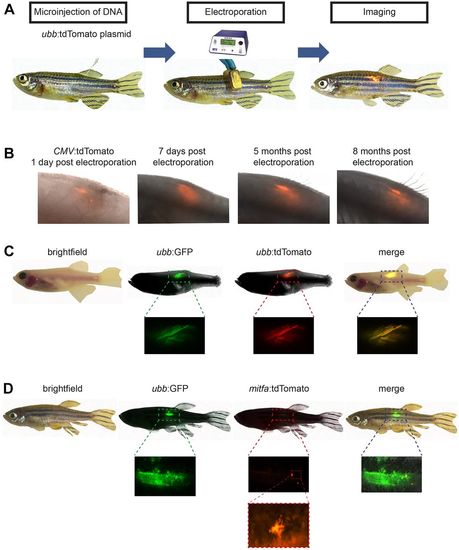
TEAZ. (A) Schematic representation of the method applied for the introduction of ubb:tdTomato directly under the dorsal fin of adult zebrafish. The purified plasmid DNA (1 μl of a 1000 ng/μl solution of ubb:tdTomato) is injected into anesthetized zebrafish using a pulled glass micropipette. Electrical pulses are directed across the injected region (settings: LV mode, 45 V, 5 pulses, 60 ms pulse length and 1 s pulse interval). Reporter expression can be visualized by fluorescent microscopy (n=2/2). (B) Electroporation of a CMV:tdTomato plasmid was performed and the animal followed for a period of 8 months (n=2/2). The fluorescent signal can be visualized as early as 1 dpe, with intensity peaking at ∼1 week and maintaining for at least 8 months. (C) Multiple plasmids will co-integrate in TEAZ. casper zebrafish were electroporated with a total volume of 1.0 μl (0.5 μl of 1000 ng/μl ubb:GFP and 0.5 μl of 1000 ng/μl ubb:tdTomato) and imaged using BF, GFP and tdTomato (n=3/3), revealing co-expression of the plasmids. (D) Promoter specificity is maintained following TEAZ. AB fish were electroporated with 1.0 μl total volume (0.5 μl of 1000 ng/μl ubb:GFP and 0.5 μl of 1000 ng/μl mitfa:tdTomato) and displayed highly restricted expression of the mitfa reporter plasmid, but widespread expression of the ubb plasmid (n=9/9). High-resolution imaging of the tdTomato+ cells reveals a dendritic phenotype, consistent with the melanocytic lineage. |

Generation of a novel melanoma model with TEAZ. (A) mitfa:BRAFV600E;tp53−/−;mitfa−/− zebrafish (triple strain) were electroporated with the miniCoopR:GFP plasmid that both rescues melanocytes and expresses GFP under the mitfa promoter, with (n=10) or without (n=9) two additional plasmids to genetically knockout rb1 (ubb:Cas9 and zfU6:sgRNA against rb1). The electroporated zebrafish were then imaged over time by both fluorescence and brightfield to monitor tumor development. Overall, 17/20 electroporated zebrafish had GFP+ cells. Tumor development in a representative zebrafish from the melanoma model including rb1 knockout is shown. (B) Higher-magnification view of the tumor-bearing animal shown in A at 16 weeks postelectroporation. (C) At 9 weeks postelectroporation, 4/8 zebrafish had evidence of GFP+ distant micrometastases in the head. (D) The loss of rb1 is essential for tumor initiation as visualized by the Kaplan–Meier curve comparing zebrafish electroporated with miniCoopR:GFP with or without rb1 sgRNA. Log-rank (Mantel–Cox) test was used for statistical analysis (****P<0.0001). |

Melanoma model using TEAZ show evidence of rapid progression. (A) Pathology of tumor-bearing zebrafish (n=1) (along with control zebrafish, n=2) at 16 weeks postelectroporation, stained with H&E or anti-GFP immunohistochemistry, demonstrates a large primary tumor that is uniformly GFP+. (B-D) Histology reveals evidence of extensive invasion into the muscle (arrows) (B) along with micrometastatic sites within the kidney (C) or along blood vessels (arrows) (D). Images are visualized at 4× and 40×. Scale bars: 500 μm (4×) and 50 μm (40×). Dashed line boxes indicate the area enlarged at 40×. |

Histological comparison of the embryo injection melanoma model and TEAZ melanoma model. (A) The left images show a melanoma created by injection of an mitfa:BRAFV600E-tdTomato (fusion) transgene into a tp53−/− background (n=1). Right images show a TEAZ-based melanoma created by electroporation of miniCoopR:GFP plus ubb:Cas9 plus zfU6:sgRNA against Rb1 (n=1) (example shown is fish at 16 weeks also shown in Fig. 2A). (B) H&E staining of both tumors shows similar histology, although with increased melanin pigmentation in the TEAZ tumor (also shown in Fig. 3A). (C,D) Antibody staining against BRAFV600E shows that both tumors are widely BRAFV600E positive, which correlates with high levels of phospho-ERK staining. (E) Reflecting the neural crest origin of melanocytes, both tumors show strong nuclear expression of SOX10. Images are visualized at 4× and 40×. Scale bars: 500 μm (4×) and 50 μm (40×). Dashed line boxes indicate the area enlarged at 40×. |

Cancer modeling with TEAZ enables sequential electroporation of transgenes. A tumor-bearing fish (created with rb1 sgRNA as in Fig. 2) was imaged using GFP and tdTomato. As expected, only GFP+ tumor cells were seen, with no expression in the tdTomato channel. This tumor was then electroporated with an mitfa:tdTomato plasmid and re-imaged 5 days later, showing areas that are now both GFP+ and tdTomato+ (n=2). |

TEAZ can be used to introduce transgenes in the adult brain and heart. (a) Purified plasmid encoding ubb:GFP (1μl of a 1000 ng/μl solution) was injected through the skull of an anesthetized casper zebrafish directly into the brain cavity using a pulled glass micropipette. The injected zebrafish is then electroporated across the dorsal-ventral axis of the head with the cathode positioned below the jaw and imaged for GFP fluorescence (n=4/5). (b) Pathology of the same electroporated casper zebrafish with hematoxylin and eosin or immunochemistry against GFP to demonstrate reporter expression. Images are visualized at 4x and 20x where scale bars represent 500 μm and 100 μm respectively. (c) TEAZ can be extended to expression within the heart of adult zebrafish. Casper fish were injected into the heart through the gills with 1 μl of 1000ng/μl of a plasmid carrying the myl7:GFP transgene (along with a ubb:Cre cassette that is unrelated for the purposes of this study) (n=2/4). Video of the beating fluorescent heart can be seen in Supplementary Video 1. |

Comparison of Rb1 expression in the F0 embryo injection melanoma (n=1) versus the TEAZ melanoma (n=1). On the left is a melanoma created by injection of an mitfa:BRAF-tdTomato(fusion) transgene into a p53-/- background. On the right is a TEAZ based melanoma created by electroporation of miniCoopR-GFP plus ubb:Cas9 plus zfU6:sgRNA against Rb1. Whereas most of the tumor in the traditional BRAF injected tumor is positive for Rb1 (red staining), the majority of the cells in the TEAZ tumor stain negatively. |

Cancer model using TEAZ shows evidence of one tumor of mixed origin (n=1). (a) Fluorescent and brightfield imaging demonstrated a large primary tumor at the site of electroporation at 12 weeks post-electroporation with patchy GFP expression. (b) Imaging the zebrafish dorsally illustrates the large raised tumor from the contour of the animal. (c) Pathology of the tumor by hematoxylin and eosin or immunochemistry against GFP revealed that part of the deep tumor was GFP-negative and did not resemble a melanoma, but instead appeared consistent with a sarcoma. Images are visualized at 4x and 40x where scale bars represent 1 mm and 50 μm respectively. The blue boxes represent the area of sarcoma enlarged at 40x and the red boxes represent the area of melanoma enlarged at 40x. |