
- Title
-
Loss of runx1 function results in B cell immunodeficiency but not T cell in adult zebrafish.
- Authors
- Chi, Y., Huang, Z., Chen, Q., Xiong, X., Chen, K., Xu, J., Zhang, Y., Zhang, W.
- Source
- Full text @ Open Biol.

ZFIN is incorporating published figure images and captions as part of an ongoing project. Figures from some publications have not yet been curated, or are not available for display because of copyright restrictions. |
|
ZFIN is incorporating published figure images and captions as part of an ongoing project. Figures from some publications have not yet been curated, or are not available for display because of copyright restrictions. PHENOTYPE:
|
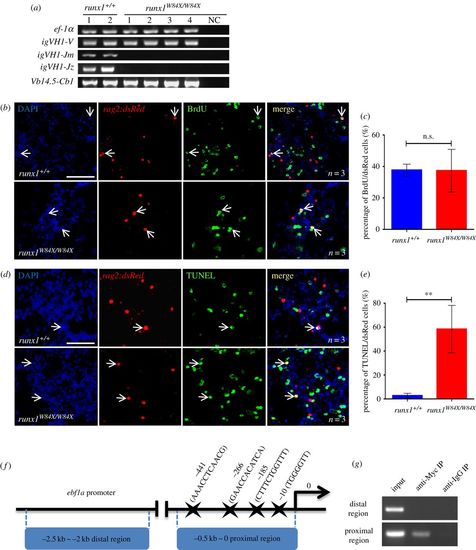
Deficiency of B cells development in runx1W84X/W84X mutants. (a) V(D)J rearrangements of igm, igz and V(DJ)C rearrangement of tcrβ analysis in kidney marrow from runx1+/+ (n = 2) and runx1W84X/W84X mutants (n = 4) by semi-nested PCR. The ef-1α and igVH1-V PCR were used as positive control. NC, negative control. (b–c) Cell proliferation assay of B cells in kidney marrow of runx1+/+ and runx1W84X/W84X mutants. (b) Triple staining of DAPI, rag2:dsRed and BrdU. Blue: DAPI, red: dsRed, green: BrdU; arrows indicate DAPI staining, rag2:dsRed staining, BrdU staining and triple co-staining cells. (c) Comparison of percentage of rag2:dsRed+ cells for BrdU co-staining cells between runx1+/+ (blue bar, n = 3) and runx1W84X/W84X mutants (red bar, n = 3). Unpaired Student's t-test; p < 0.05; ns, no significance; mean ± s.e.m. (d–e) Cell apoptosis assay of B cells in kidney marrow of runx1+/+ and runx1W84X/W84X mutants. (d) Triple staining of DAPI, rag2:dsRed and TUNEL. Blue: DAPI, red: dsRed, green: TUNEL; arrows indicate DAPI staining, rag2:dsRed staining, TUNEL staining, and triple co-staining cells. (e) Comparison of percentage of rag2:dsRed+ cells for TUNEL between runx1+/+ (blue bar, n = 3) and runx1W84X/W84X mutants (red bar, n = 3). (f) Schematic diagram of the 2.5 kb ebf1a promoter region. The transcription initiation site is designated as 0. Putative Runx1 consensus sites (marked by stars) are shown. (g) Semi-quantitative PCR analysis of the enrichment of the −0.5 ∼ 0 kb proximal region (ii) and the −2.5 ∼ −2 kb distal region (i). The left lanes were input DNA control. Each experiment was performed in duplicate. Unpaired Student's t-test; mean ± s.e.m; **p < 0.01; scales bars, 100 µm. PHENOTYPE:
|
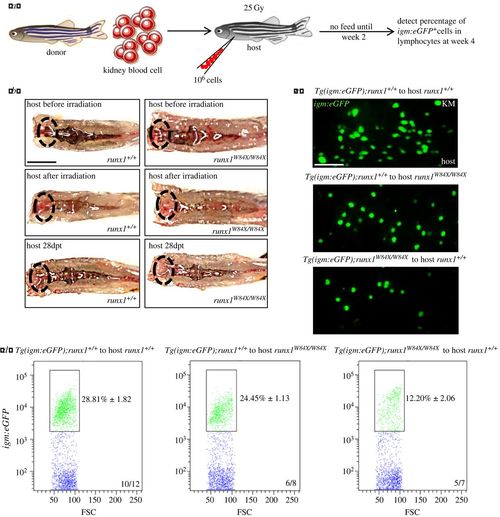
Cell-autonomous regulation of runx1 in B cells development. (a) Schematic outline showing procedure of transplantation. (b) Macroscopic representation of kidney marrow of donors (top), donors after irradiation (middle) and hosts reconstituted with donors kidney morrow (below, 4 weeks after transplantation). Ovals indicate the locations of the head kidneys; dpt, day post transplantation; scales bars, 5 mm. (c) Fluorescent representation of igm:eGFP+ from reconstituted kidney morrow of hosts (4 weeks after transplantation). Scales bars, 100 µm. (d) Percentage of igm:eGFP+ in lymphocytes from reconstituted hosts kidney marrow were calculated by FACS analysis. Each experiment was performed in duplicate. Black boxes outline the captured igm:eGFP+ cells with fluorescence in lymphocytes region of kidney marrow. |
|
ZFIN is incorporating published figure images and captions as part of an ongoing project. Figures from some publications have not yet been curated, or are not available for display because of copyright restrictions. PHENOTYPE:
|

Fragile growth in runx1W84X/W84X mutants. A: Pictures showing morphology of WT and hypoplasia of dying runx1W84X/W84X mutants. B: Survival curve of WT and runx1W84X/W84X mutants. log-rank test, **P<0.01. PHENOTYPE:
|