
- Title
-
RES complex is associated with intron definition and required for zebrafish early embryogenesis
- Authors
- Fernandez, J.P., Moreno-Mateos, M.A., Gohr, A., Miao, L., Chan, S.H., Irimia, M., Giraldez, A.J.
- Source
- Full text @ PLoS Genet.
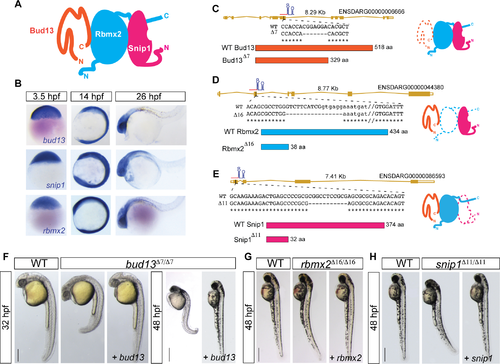
RES complex is essential for early vertebrate development. (A) Schematic model of the RES complex adapted from Brooks et al. [8]. Rbmx2 (light blue) is the core subunit with an RRM-domain structure. Bud13 (orange) and Snip1 (pink) interact with Rbmx2 (light blue). (B) In situ hybridization showing spatial and temporal expression of RES complex members. (C-E) Gene models of the mutant allele generated using CRISPR-Cas9-nanos. (C) bud13, 7 nt deletion in exon 6 generated a premature stop codon. (D) rbmx2, 16 nt deletion removed exon-intron boundary at exon 2 (exon capital letter, intron lower letter). (E) snip1, 11 nt deletion in exon 1 generated a premature stop codon. f-g) Lateral view of RES complex mutant embryos, their corresponding WT sibling and mutants injected with the cognate mRNA. (F) bud13 mutant at 32 hpf (scale bar: 0.35mm) and at 48 hpf (scale bar: 0.5mm). (G, H) rbmx2 and snip1 mutant at 48 hpf respectively. WT: represent phenotypically wild type sibling from the same mutant fish line. |

RES complex is required during zebrafish brain development. (A) Acridine orange (ao) staining of zebrafish mutant embryos for bud13 (30–32 hpf), rbmx2 and snip1 (48 hpf). Mutants show a marked degree of cells with nuclear uptake of ao compared to WT sibling most predominantly in the head. WT: represent phenotypically wild type sibling from the same mutant fish line. (B) Maximum intensity projections of individual and merged channels (GFP and dsRed) of 3D confocal images of bud13Δ7/Δ7 and their wild-type siblings (scale bar 20 μm) in transgenic lines that label GABAergic neurons and precursors (Tg[dlx6a-1.4kbdlx5a/ dlx6a:GFP]) and glutamatergic neurons (Tg[vglut:DsRed]). WT: represent phenotypically wild type sibling from the same mutant fish line. (C) Total number of dlx5a/6a:GFP+ cells (GABAergic neurons and precursors) and vglut:DsRed+ cells (glutamatergic neurons) in the forebrain of the bud13Δ7/Δ7 (n = 3) and WT sibling (n = 4) were quantified. *** vglut: P = 2 x 10⁻⁴; ***dlx5a/6a: P = 3 x 10⁻⁴ (one-way ANOVA). |

ZFIN is incorporating published figure images and captions as part of an ongoing project. Figures from some publications have not yet been curated, or are not available for display because of copyright restrictions. |
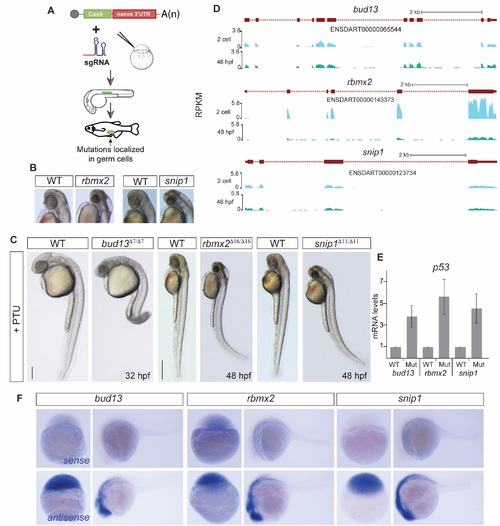
RES complex is required during zebrafish development. (A) Scheme illustrating the Cas9-nanos 3′-UTR strategy [20]. The nanos' 3′-UTR concentrates the expression of Cas9 in the germ cells (green circles). (B-C) Bright field microscopy of RES mutant embryos and their corresponding phenotypically wild type sibling (WT), treated with PTU to avoid melanocyte production, in lateral view (C) or magnification (B, for rbmx2 and snip1). Increased levels of apoptosis, predominantly in the head, are observed upon RES loss-of-function. (scale bar: 0.5mm at 48 hpf; 0.35mm at 32 hpf). (D) UCSC genome tracks showing mRNA levels of RES complex members at 2 cell and 48 hpf stages. (E) RT-qPCR showing p53 mRNA levels. Error bars represent SD of the mean from two independent biological replicates (n = 10 embryos per biological replicate). A p53 up-regulation in the mutants compared to phenotypically WT siblings correlates with the increased cell dead observed in the brain. (F) In situ hybridization showing RES components sense (top) and antisense (bottom) probes. Lack of expression in the sense probes show the specifity of the RES expression pattern in the zebrafish developing embryos. |
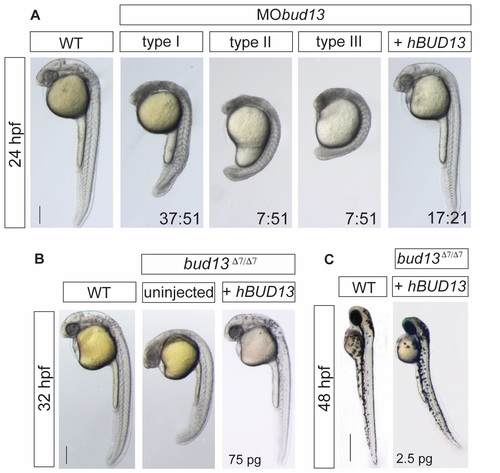
bud13 knock-down show stronger cell death phenotype. (A) Lateral view of WT embryos injected with 0.6mM of morpholino antisense oligonucleotide against bud13 mRNA (MObud13) showing different levels of developmental defects (types I to III). Phenotypes are fully rescue with human hBUD13 mRNA. (scale bar: 0.5mm). WT: represent phenotypically wild type sibling from the same mutant fish line. Stronger phenotype is likely due to a depletion of the maternal contribution. (B) bud13 mutant embryos fully rescued by providing 75 pg of hBUD13 mRNA, suggesting that Bud13 function may be conserved across vertebrates (scale bar: 0.5mm). WT: represent phenotypically wild type sibling from the same mutant fish line. (C) 48 hpf, bud13Δ7/Δ7 embryos showing a similar phenotype to rbmx2Δ16/Δ16 and snip1Δ11/Δ11 when partly rescued by injection of 2.5 pg of hBUD13 mRNA (scale bar: 1mm). WT: represent phenotypically wild type sibling from the same mutant fish line. |

CNS molecular markers show mild differences in bud13Δ7/Δ7. In situ hybridization showing expression pattern of shh (notochord and floor plate), krox20 (egr2a; rhombomere 3 and 5) and pax2a (anterior midbrain-hindbrain boundary and hindbrain neurons) in WT (top) and mutant (bottom) embryos. |