
- Title
-
JDP2: An oncogenic bZIP transcription factor in T cell acute lymphoblastic leukemia
- Authors
- Mansour, M.R., He, S., Li, Z., Lobbardi, R., Abraham, B.J., Hug, C., Rahman, S., Leon, T.E., Kuang, Y.Y., Zimmerman, M.W., Blonquist, T., Gjini, E., Gutierrez, A., Tang, Q., Garcia-Perez, L., Pike-Overzet, K., Anders, L., Berezovskaya, A., Zhou, Y., Zon, L.I., Neuberg, D., Fielding, A.K., Staal, F.J.T., Langenau, D.M., Sanda, T., Young, R.A., Look, A.T.
- Source
- Full text @ J. Exp. Med.
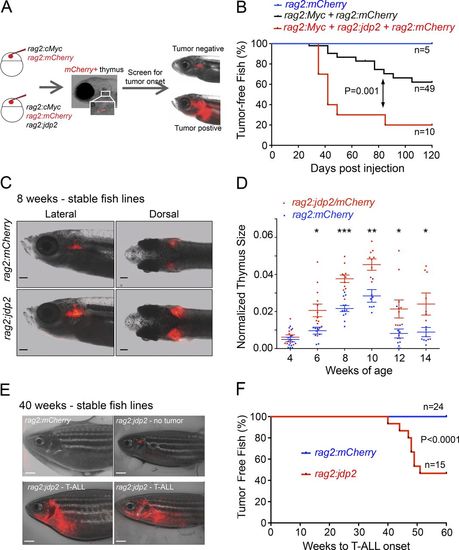
Jdp2collaborates with Myc and can initiate T-ALL in a zebrafish model. (A) Schematic showing the coinjection strategy used to identify Myc collaborating genes in first generation mosaic transgenic zebrafish. (B) Kaplan–Meier curves showing tumor onset in first-generation mosaic zebrafish coinjected with constructs expressing rag2:Myc + rag2:jdp2 + rag2:mCherry (red line), versus rag2:Myc + rag2:mCherry versus (black line), versus rag2:mCherry alone (blue line). (C) Representative fluorescent images of thymuses from 8-wk-old stable transgenic zebrafish expressing Tg(rag2:mCherry) and Tg(rag2:jdp2). Bars, 1 mm. (D) Quantification of thymus size from Tg(rag2:mCherry) and Tg(rag2:jdp2) assessed by fluorescent microscopy biweekly from 4 to 14 wk of age. To account for intervariation in fish size, thymus size was normalized to head size. * P<0.05; ** P<0.005; *** P<0.0005. Data points represent the mean ± standard error of the mean. (E) Representative fluorescent microscopy images from a 40-wk-old Tg(rag2:mCherry), and three Tg(rag2:jdp2) zebrafish. Bars, 1 mm. (F) Kaplan–Meier curves showing tumor onset in stable Mendelian transgenic zebrafish expressing Tg(rag2:mCherry; red line) and Tg(rag2:jdp2; blue line). PHENOTYPE:
|
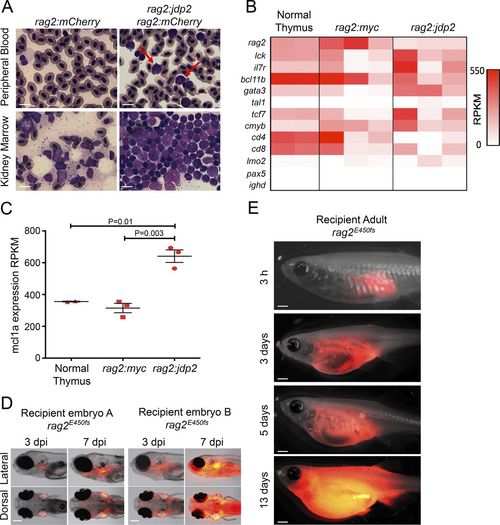
Jdp2initiates a transplantable T-ALL when expressed from the rag2 promoter. (A) Hematoxylin and eosin staining of peripheral blood and kidney marrow smears from 11-mo-old Tg(rag2:mCherry) and Tg(rag2:jdp2) fish. Note that red blood cells are nucleated in normal zebrafish. Black arrow identifies a mature myeloid cell, and red arrows, circulating blast cells. Bars, 10 µm. (B) Heatmap showing expression of selected genes from FACS-purified cells from normal thymocytes from Tg(rag2:mCherry) zebrafish (each column n = 10 pooled), and tumors from Tg(rag2:jdp2) and Tg(rag2:Myc) fish (each column represents an individual fish), as determined by RNA-seq. RPKM, reads per kilobase of exon per million fragments mapped. (C) mcl1a expression by RNA-seq analysis of FACS-purified fluorescent cells. For the Tg(rag2:Myc) and Tg(rag2:jdp2) genotypes, each data point represents an individual fish, whereas for normal thymus, each point represents pooled cells harvested from 10 Tg(rag2:mCherry) animals. (D) Tumor cells were harvested from Tg(rag2:jdp2) fish and injected into the circulation of 2-d-old recipient fish homozygous for a hypomorphic rag2 allele (E450fs). Two representative embryos are shown, and findings were validated in two independent experiments. Bars, 0.1 mm. (E) Tumor cells harvested from Tg(rag2:jdp2) fish were injected into the peritoneum of adult homozygous rag2E450fs fish. Recipients were monitored by fluorescence imaging. Findings were validated in three independent experiments. Bars, 0.5 mm. |
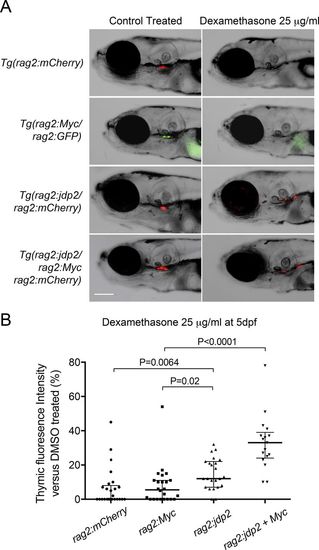
Thymuses of Tg(rag2:jdp2) fish are resistant to dexamethasone. (A) Representative fluorescent images of thymuses from 8-d-old stable transgenic zebrafish larvae exposed to dexamethasone (25 µg/ml) or DMSO control, from day 5 postfertilization (dpf). Bar, 0.1 mm. (B) Quantification of thymic fluorescence in 8-d-old stable transgenic zebrafish larvae exposed to 25 µg/ml dexamethasone or DMSO control from 5 dpf. Values are expressed as a percentage of thymic fluorescence in DMSO control treated zebrafish, and P values were calculated using two-tailed Student’s t test. Findings were validated in three independent experiments. |

jdp2 leads to delayed thymic involution in Tg(rag2: jdp2) zebrafish. (A) Hematoxylin and eosin staining of sagittal sections of 23-wk-old zebrafish from Tg(rag2: mCherry) and Tg(rag2: jdp2) zebrafish. Thymus is the collection of blue cells, as highlighted with red arrow. Representative image from three zebrafish. Bars, 1 mm. (B) qPCR for the T cell marker CD3, from tumors from Tg(rag2: Myc) and Tg(rag2: jdp2) zebrafish, and normal thymocytes from Tg(rag2: mCherry) fish. Representative data from two independent experiments performed in triplicate are shown. Data points represent the mean ± standard error of the mean. |