
- Title
-
A Model of Superinfection of Virus-Infected Zebrafish Larvae: Increased Susceptibility to Bacteria Associated With Neutrophil Death
- Authors
- Boucontet, L., Passoni, G., Thiry, V., Maggi, L., Herbomel, P., Levraud, J.P., Colucci-Guyon, E.
- Source
- Full text @ Front Immunol

Increased susceptibility to co-infection is only observed when virus is injected first. Zebrafish larvae were sequentially injected in the bloodstream with Sindbis virus (SINV) and Shigella at 72 and 96 hpf and larvae injected with SINV or Shigella alone were used as a control as depicted in Figure 1. Survival, bacterial burden, and viral replication were evaluated over time in SINV + Shigella (A,C,E) and in Shigella + SINV (B,D,E) sequentially infected larvae settings. (A,C,E) Data pooled from three independent experiments; (B,D,E) data from one experiment; see also Figures S2A,B in Supplementary Material. Survival curves of zebrafish larvae injected with SINV + Shigella (A) (blue curve) or with Shigella + SINV (B) (cyan curve) and incubated at 28°C. For both sequential co-infection settings, fish injected with Shigella (red curves) or with SINV (green curves) alone at the appropriate time point, and non-injected fish (black curves) were used as controls. n = 72 (A) or 24 (B) fish for each condition. (C,D) Bacterial burden quantification by enumerating live bacteria in homogenates from individual larvae sequentially co-infected with SINV + Shigella (C) (blue symbols) or Shigella + SINV (D) (cyan symbols) or with Shigella alone (red symbols) measured by plating onto LB immediately after Shigella injection and 24 h post Shigella injection. n = 15 (C) or 5 (D) larvae for each condition. (E,F). Viral replication measured by RT-qPCR from individual infected larvae in SINV-Shigella (E) (blue curve) or Shigella-SINV (F) (cyan curve) sequentially co-infected fish, or SINV (green curves). n = 15 (E) or 5 (F) larvae for each condition. (G) Representative images of virus (SINV-GFP) and bacteria (Shigella-DsRed) dissemination, determined by live imaging using a fluorescence stereomicroscope, of zebrafish larvae infected with SINV-GFP alone at 72 hpf, or with Shigella DsRed alone at 96 hpf, or sequentially co-infected with SINV-GFP first and Shigella-DsRed 1 day later. Non-infected larvae (CTRL) are also shown. The same infected larvae were live imaged 4 and 24 h post Shigella injection. Overlay of GFP and DsRed fluorescence is shown, except in SINV panels, where only GFP fluorescence was recorded. |

Impaired neutrophil counts upon Shigella injection in Sindbis virus (SINV) infected fish. (A) mpx:GFP zebrafish larvae (green neutrophils) were sequentially injected intravenously with sublethal doses of SINV-GFP at 72 hpf and the day after with sublethal doses of Shigella-DsRed. As a control, similar doses of SINV-GFP only and Shigella DsRed only were injected in the blood of 72 and 96 hpf mpx:GFP larvae, respectively. The infected larvae were then imaged with a wild field fluorescent microscope over time at 100 hpf (4 h post Shigella injection) and at 120 hpf (24 h post Shigella injection) to monitor the impact of the co-infection on the neutrophil population at the level of the entire organism. Note that it was possible to discriminate under the microscope the GFP label of the SINV-GFP infected cells (diffuse and less bright) from the GFP label of the mpx:GFP neutrophils (brighter). The neutrophil numbers appeared to be decreased in SINV-Shigella co-infected larvae. Overlay of green (SINV and neutrophils) and red (Shigella) fluorescence from single or co-infected fish is shown. (B) Neutrophil counts in uninfected (CTRL, black symbols) or upon sublethal SINV-GFP (green symbols), Shigella-DsRed (red symbols) injection or sequential SINV + Shigella (blue symbol) injection. Neutrophils were counted from images taken on live infected larvae using ImageJ software, and plotted as specified in Section “Materials and Methods.” Mean ± SEM are also shown (horizontal bars). Data plotted are from two pooled independent experiments (n = 7 larvae scored for each condition). |
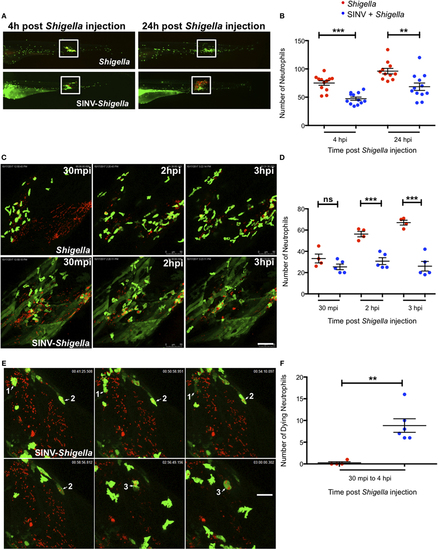
Impaired neutrophil recruitment and survival in Sindbis virus (SINV)- > local Shigella co-infection. (A) 72 hpf mpx:GFP larvae were sequentially injected with SINV-GFP in the bloodstream then subcutaneously with Shigella-DsRed one day later (96 hpf). As control, mpx:GFP larvae were injected subcutaneously with Shigella only at 96 hpf. The infected larvae were imaged with a fluorescent stereomicroscope over time at 100 hpf (4 h post Shigella infection) and at 120 hpf (24 h post Shigella infection), to monitor neutrophil recruitment to the locally injected bacteria. Overlay of green (SINV and neutrophil) and red (Shigella) fluorescence is shown. The white box indicates the region chosen to count the recruited neutrophils. (B) Neutrophil recruitment quantification upon sublethal Shigella-DsRed (red symbol) injection or sequential SINV + Shigella (blue symbols) injection. Neutrophils were counted from images taken on live infected larvae [white box delimitated the region chosen to count the recruited neutrophils in (A)] using ImageJ software, and plotted as specified in Section “Materials and Methods.” Data are from one experiment (n = 12 larvae scored for each condition). Mean ± SEM are also shown (horizontal bars). (C) Frames extracted from maximum intensity projection of in vivo time-lapse confocal imaging sessions of 96 hpf mpx:GFP larvae injected subcutaneously with Shigella-DsRed alone (top panel) or of SINV + Shigella co-infected larvae that had been injected one day before with SINV-GFP in the bloodstream (at 72 hpf) (bottom panel). Overlay of green (SINV and neutrophils) and red (Shigella) fluorescence of the caudal area of the larvae is shown. Time indicated on the frames is upon subcutaneously Shigella injection. See also Video S1 in Supplementary Material. Scale bar: 50 µm. (D) Neutrophil recruitment quantification upon subcutaneous Shigella-DsRed (red symbol) injection or sequential bloodstream SINV-GFP injection followed the day after by subcutaneous Shigella-DsRed (blue symbols) injection. Neutrophils were manually counted at 30 min, 2 and 3 h post Shigella injection from maximum intensity projections frames of confocal acquisitions of live infected larvae (to count the recruited neutrophils the region taken into consideration is shown in (B) and plotted as specified in Section “Materials and Methods.” Data plotted are from n = 4 to 5 larvae scored for each condition. Mean ± SEM are also shown (horizontal bars). (E) Frames extracted from maximum intensity projection of confocal acquisition of SINV + Shigella mpx:GFP co-infected larvae. SINV-GFP was injected in the bloodstream at 72 hpf and Shigella-DsRed was subcutaneously injected the day after, at 96 hpf. The acquisition of the infected larvae was started about 30 min after Shigella injection. Three dying Shigella engulfing neutrophils are shown (annotated as 1, 2, and 3 on the frames). Overlay of green (SINV and neutrophils) and red (Shigella) fluorescence of the caudal area of the larvae is shown. Time indicated on the frames is upon subcutaneously Shigella injection. See also Video S2 in Supplementary Material. Scale bar: 20 µm. (F) Dying neutrophils quantitation upon subcutaneous Shigella-DsRed (red symbol) injection or sequential bloodstream SINV-GFP injection followed the day after by subcutaneous Shigella-DsRed (blue symbols) injection. Dying neutrophils were manually tracked and quantified from maximum intensity projections of confocal acquisitions and plotted as specified in Section “Materials and Methods.” Data plotted are from n = 4 Shigella-infected larvae and n = 6 SINV + Shigella-infected larvae scored. Mean ± SEM are also shown (horizontal bars). |