
- Title
-
Guided genetic screen to identify genes essential in the regeneration of hair cells and other tissues
- Authors
- Pei, W., Xu, L., Huang, S.C., Pettie, K., Idol, J., Rissone, A., Jimenez, E., Sinclair, J.W., Slevin, C., Varshney, G.K., Jones, M., Carrington, B., Bishop, K., Huang, H., Sood, R., Lin, S., Burgess, S.M.
- Source
- Full text @ NPJ Regen Med

The screening pipelines. a The pipeline for screening mutations obtained by retroviral integration. Homozygous embryos from the F2 generation were used for screening. Mutations obtained by ENU or gene/protein trap were also screened using homozygotes from the F2 generation. b The pipeline for screening mutations obtained by CRISPR/Cas9. Multiplex targeting was usually used to generate CRISPR/Cas9 mutations, by co-injecting 2–6 single-guide RNA (sgRNA) together with Cas9 mRNA. Compound heterozygotes in the F1 generation were used for screening when the sgRNAs had sufficient measured somatic activity. Homozygotes or compound heterozygotes from the F2 generation were used when there were not enough compound heterozygotes found in the F1 generation
|

Mutations causing embryonic phenotypes. a Retroviral mutations causing embryonic phenotypes. Degree of severity ranged for the early embryonic phenotypes. snapc1b mutants appeared essentially normal but they failed to inflate the swim bladder and eventually die by day 10. etf1 mutants had severe craniofacial defects, small eyes, and cardiac edema. rps20mutants were the most severely disrupted with severe growth retardation and an overall failure to thrive. b CRISPR/Cas9 mutations causing embryonic phenotypes. The mutants in heat shock family proteins hspe1 and hspa13 and small nuclear protein snrnp25 all appeared normal but failed to inflate the swim bladder and eventually die around day 10–15. snrnp48mutants had small eyes and abnormal jaw structure. taf5 mutants display craniofacial defects. β-catenin (ctnnb1) mutants have disrupted tail development, heart edemas and reduced head and eyes
|

Mutations specifically affecting hair cell regeneration. a A fluorescent image of a zebrafish embryo at 5 dpf stained with Yopro-1, showing the distribution of neuromast hair cells. Arrows point to the P1–P4 neuromasts that were used for hair cell counting. b A magnified image of neuromast hair cells in the P1 neuromast. c–g Quantification of impaired hair cell regeneration caused by rnpc3la028632 retroviral insertional mutation (c), hspe1hg77 (6 bp CRISPR deletion) mutation (d), hspa13hg78 (12 bp CRISPR deletion) mutation (e), smn1fh299 (ENU missense Y262X) mutation (f), and gemin5hg80(1 bp CRISPR deletion) mutation (g). The graphs are obtained from analyzing and then genotyping ~45 embryos generated from a pairwise incross of heterozygotes. Graphs show the mean and s.e.m. The difference between the wild-types and homozygotes is significant for all mutations (p < 0.05)
PHENOTYPE:
|
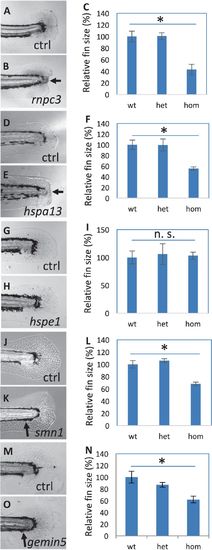
Fin regeneration in the mutants affecting hair cell regeneration. a–c Regenerated fins in the control (a) and rnpc3la028632 (b), and the quantification of the fin areas (c). d–fRegenerated fins in the control (d) and hspa13hg78 mutants (e), and the quantification of the fin areas (f). g–i Regenerated fins in the control (g) and hspe1hg77 mutant (h), and the quantification of the fin areas (i). j–l Regenerated fins in the control (j) and smn1fh299 mutant (k), and the quantification of the fin areas (l). m–o Regenerated fins in the control (m) and gemin5hg80 mutant (n), and the quantification of the fin areas (o). Arrows in b and e point to a lack of caudal fin fold in rnpc3 and hspa13 mutants. Arrows in k and o point to a lack of ventral pigment gap in smn1 and gemin5 mutants. Graphs are generated by analyzing more than eight embryos per genotype. Error bars show the s.e.m. There was no difference in the regeneration between wild-type and heterozygotes for all the mutations, so control (Ctrl) is used to represent both. There is a significant difference between the wild-type and mutant embryos for mutations in rnpc3, hspa13, smn1, and gemin5 (p < 0.05 for all), but not for mutation in hspe1 (n. s.)
PHENOTYPE:
|
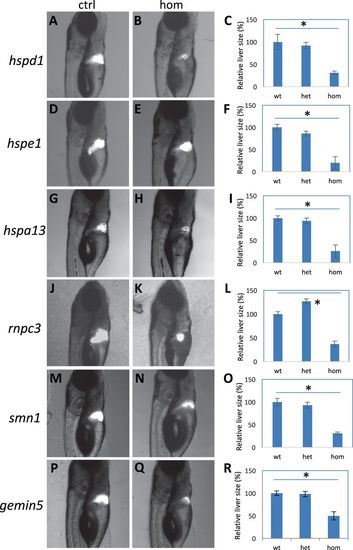
Liver regeneration in the mutants. a–c Regenerated liver in the control (a) and hspd1la026911 mutant (b), and the quantification of the liver areas (c). d–f Regenerated liver in the control (d) and hspe1hg77 mutant (e), and the quantification of the liver areas (f). g–i Regenerated liver in the control (g) and hspa13hg78 mutant (h), and the quantification of the liver areas (i). j–l Regenerated liver in the control (j) and rnpc3la028632 mutant (k), and the quantification of the liver areas (l). m–o Regenerated liver in the control (m) and smn1fh299 mutant (n), and the quantification of the liver areas (o). p–r Regenerated liver in the control (p) and gemin5hg80 mutant (q), and the quantification of the liver areas (r). Graphs are generated from analysis of approximately 45 CFP-positive embryos obtained by crossing one fish carrying heterozygous gene mutation with the other fish carrying heterozygous mutation and an allele of Tg(fabp10:CFP-NTR). Error bars show the s.e.m. Control (Ctrl) represents both wild-type and heterozygotes, as there was no difference observed between them. A significant difference was observed between the wild-type and the mutant for all the mutations (p < 0.05 for all)
PHENOTYPE:
|

Injury-induced expression is associated with regeneration. a Whole-mount in situ analysis of gene expression after fin amputation. Arrows point to the injury-induced expression at the amputation sites. TAB-5 wild-type embryos at 3 dpf were used for fin amputation, and the amputated embryos were fixed at 15 h post amputation for whole-mount in situ analysis. TAB-5 wild-type embryos at 4 dpf without amputation were used as the control. b Quantitative PCR analysis of gene expression during maternal stages (1-cell, 16-cell), maternal–zygotic transition (512-cell), and later stages (dome, 1 dpf, and 5 dpf). Beta-actin was used as internal reference. The sequences for the primers used for the probe synthesis and qPCR are listed in Suppl. Table 3
EXPRESSION / LABELING:
|
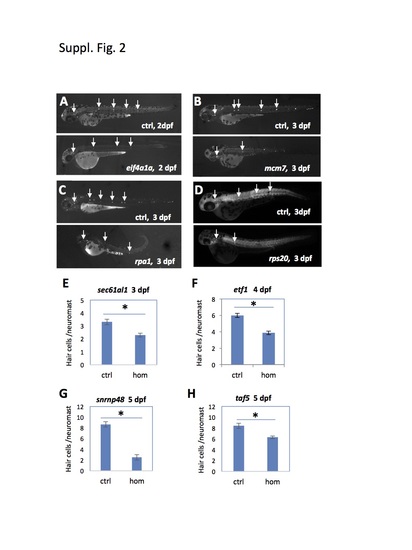
Mutations tested that affected hair cell development. (A-D) Developmental timing of neuromast hair cell formation was assayed by Yopro-1 staining (A-C) or hair cell-specific antibody staining (D). Arrows point to hair cell-positive neuromasts. Mutant embryos had smaller staining area for each neuromast and fewer neuromasts, indicating an impairment in hair cell development. (E-H) Quantification of neuromast hair cell development by counting Yopro-1 positive hair cells. Compared to the control (Ctrl) siblings, homozygous (hom) mutants of sec61a1show a significant reduction in the average number of hair cells per neuromast.
|

Mutations tested that affected hair cell development as well as hair cell regeneration. (A-C) Quantification of the development and regeneration of neuromast hair cells in the mutants homozygous for snrnp25 (A), hdac1 (B), and prps1a (C). Hair cell development was assayed at 5 dpf (except otherwise indicated). Hair cell regeneration was assayed by copper ablation at 5 dpf and regeneration at 7 dpf (labeled on graph as “regen”). Graph shows the mean and s.e.m. Control (ctrl) represents both wild type and heterozygotes, as no difference was observed between them. The difference between control and homozygous mutants is indicated. Asterisks indicate the difference is significant (p < 0.05). n. s. indicates the difference is not significant. PHENOTYPE:
|

hdac1 mutation causes abnormal hair cell morphology. (A-F) Confocal imaging of immunofluorescently-stained neuromasts in the control (A-C) and hdac1 mutant (D-F) embryos. Hair cells were stained in green with hair cell-specific antibodies to myo6 and myo7, neuromast nuclear DNA were stained in blue using DAPI. C and F are the magnified images of the areas boxed in B and E, respectively. White arrows in C and F point to the morphology of hair cell nuclear DNA, which is more condensed in the control embryo (C) than in the mutant embryo (F). Scale bar, 10 μm in A, B, D and E; 5 μm in C and F. |
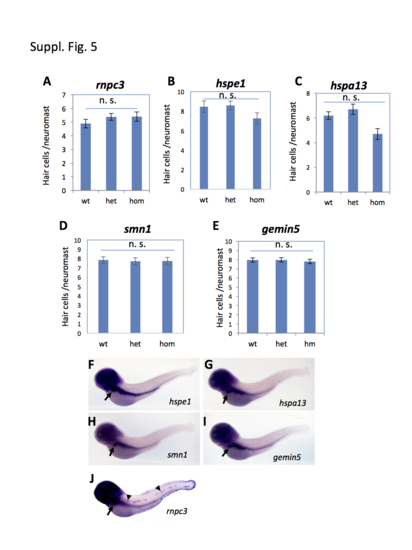
Hair cell development in the regeneration-specific mutants and the expression patterns of the identified genes. (A-E) Quantification of hair cell development in the mutant embryos carrying the rnpc3la028632 retroviral insertional mutation (A), hspe1hg76 (6 bp deletion) mutation (B), hspa13hg78 (12 bp deletion) mutation (C), smn1fh299 (ENU Y262X) mutation (D), and gemin5hg80 (1 bp deletion) mutation (E). Approximately 10 embryos were analyzed for each data point. The graphs show the mean and s.e.m. The difference between the wild-types and homozygous mutants was not significant (n. s.) for all the mutations, although there was a modest reduction trend in hspa13. (F-J) Whole-mount in situ analysis of the expression of the regeneration genes in TAB-5 wild-type embryos at 4 dpf. Arrows in F-J point to the expression in liver. Arrowheads in J point to the expression of rnpc3 in lateral line neuromasts. |

ZFIN is incorporating published figure images and captions as part of an ongoing project. Figures from some publications have not yet been curated, or are not available for display because of copyright restrictions. |
|
Unillustrated author statements |