
- Title
-
Spatio-temporal regulation of concurrent developmental processes by generic signaling downstream of chemokine receptors
- Authors
- Malhotra, D., Shin, J., Solnica-Krezel, L., Raz, E.
- Source
- Full text @ Elife

The signaling cascades initiated by Cxcr4a and Cxcr4b are functionally equivalent. (A) The position of PGCs (detected by nanos3 RNA expression, yellow) relative to tissues expressing cxcl12a (magenta) and cxcl12b (green) RNAs in 12 hpf cxcr4b-/- embryos. PGCs express control RNA (cntl, left panel) or RNAs encoding for Cxcr4b (middle panel) or Cxcr4a (right panel). 20 pg of control RNA and RNA encoding for Cxcr4a and Cxcr4b were injected. (B) Epifluorescence image of transgenic sox17::gfp embryos at 8 hpf. The embryos were injected with control (cntl) morpholino and control RNA (left panel). Experimental embryos were knocked down for Cxcr4a and Cxcl12b and the effect of control RNA, cxcr4a and Cxcl12b or cxcr4b along with cxcl12a mRNAs was examined. The quantitation of the endoderm displacement with respect to the forerunner cells is presented in the graph on the right. See also Figure 1—figure supplement 1. 0.8 pmol of each morpholino was used. 100 pg of receptor and 50 pg of ligand encoding mRNA was used, as well as equimolar amounts of control RNA. EXPRESSION / LABELING:
PHENOTYPE:
|
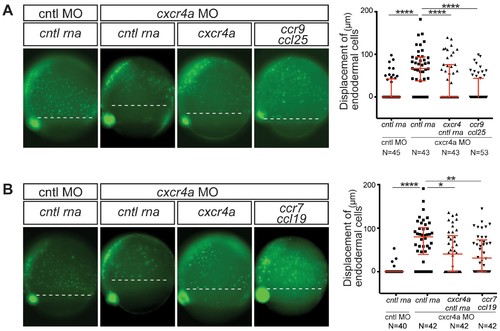
CC receptors can control a process regulated by CXC receptors. (A) Epifluorescence image of sox17::gfp transgenic control embryos (left panel) and embryos knock down for Cxcr4a. The Cxcr4a knocked down embryos were injected with control RNA (cntl) or with cxcr4a RNA, or co-injected with ccr9 RNA and its ligand ccl25 RNA. The quantitation of the endoderm displacement with respect to the forerunner cells is presented in the graph on the right. See also Figure 1—figure supplement 1. (B) Epifluorescence image of sox17::gfp transgenic control embryos (left panel) and of embryos knocked down for Cxcr4a. The embryos were injected with control RNA, with cxcr4a RNA, or co-injected with ccr7 RNA and its ligand ccl19 RNA. The quantitation of the endoderm displacement with respect to the forerunner cells is presented in the graph on the right. 0.8 pmol of each morpholino was used. 100 pg of receptor and 50 pg of ligand encoding mRNA was used, as well as equimolar amounts of control RNA. EXPRESSION / LABELING:
PHENOTYPE:
|

CC and CXC receptors can direct the migration of primordial cells. The experimental scheme is provided at the top. (A) Epifluorescence image of 10 hpf embryos expressing the control RNA or RNA encoding for the indicated ligand (Cxcl12a, Cxcl12b, Ccl25 and Ccl19) in one half of the embryo and control RNA or Receptor-encoding RNA (Cxcr4b, Cxcr4a, Ccr9 or Ccr7) in PGCs. Merged images show the position of PGCs with respect to control or ligand-expressing domains (red). (B–D) Graphs show the quantitation of the migration of PGCs as the percentage of GFP-labeled cells located within the ligand-expressing part of the embryos. 60 pg of mGFP-nanos was used to label PGCs in green and 40 pg of m-cherry mRNA was used for labeling the ligand expressing half of the embryo. 20 pg of receptor-encoding RNA was used and 30 pg of ligand-encoding RNA was used. 0.2 pmol of Cxcl12a morpholino was used. Equimolar amounts of control RNA were used. For raw data see Figure 3—source data 1. |
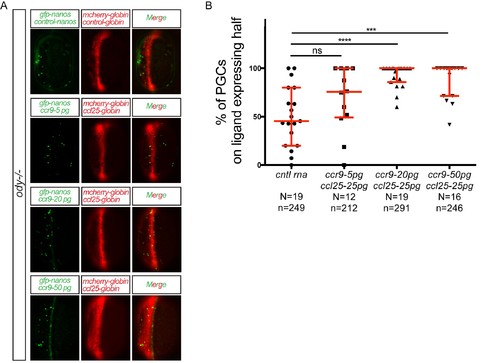
Different levels of chemokine receptor signaling leads to functionally same response. (A) Epifluorescence images of 10 hpf embryos. Embryos express the control RNA or the RNA encoding for Ccl25 in one half of the embryo and control RNA or different concentrations of RNA encoding for Ccr9 in PGCs. Merged images show the position of PGCs with respect to control or ligand-expressing domains (red). (B) Graphs show the quantitation of the migration of PGCs as the percentage of GFP-labeled cells located within the ligand-expressing domain of the embryos. 60 pg of mGFP-nanos was used to label PGCs in green and 40 pg of m-cherry mRNA was used for labeling the ligand expressing half of the embryo. For raw data see Figure 3—figure supplement 1—source data 1. |
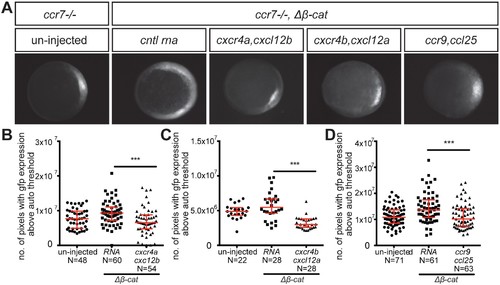
Control of dorsoventral axis specification by different chemokine receptors. (A) Epifluorescence image of 5 hpf ccr7-/- mutant embryos carrying the gsc::gfp transgene. Uninjected embryo (left panel) and embryos sensitized by injection of Δβ-Catenin encoding RNA (right panels) are presented. The embryos were also injected with control RNA (cntl) or with RNA encoding for different chemokine receptors (Cxcr4a, Cxcr4b or Ccr9) and their cognate ligands (Cxcl12b, Cxcl12a or Ccl25). (B–D) Graphs showing the area of the goosecoid expression domain determined by quantifying the number of pixels with GFP signal above the auto threshold in the different treatments. 100 pg of mRNA encoding for the receptors was injected and 60 pg of RNA encoding for the ligands. 2.5 pg of Δβ-Catenin-encoding RNA was inject to sensitize the embryos. Equimolar amounts of control RNA were used. For raw data see Figure 4—source data 1. EXPRESSION / LABELING:
|

Embryos lacking Ccr7 are hypersensitive to very low dose of Δβ-catenin. (A) Expansion of the goosecoid expression domain in early embryos. Epifluorescence image of wild-type (WT) tg gsc::gfp and ccr7-/- gsc::gfp embryos sensitized by injection of 2.5 pg of Δβ catenin RNA. (B) Graph showing the area of goosecoid domain measured by quantifying the number of pixels with GFP signal above the auto threshold. |
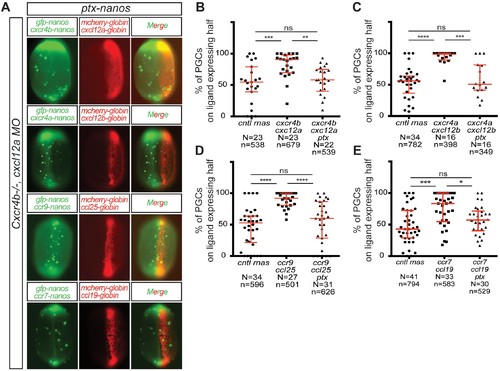
CC and CXC receptors can regulate the migration of primordial cells employing the same downstream signaling pathway. (A) Epifluorescence image of 10 hpf embryos expressing different ligands (Cxcl12a, Cxcl12b, Ccl25 and Ccl19) in one half of the embryo (mCherry-expressing cells) and PGCs (mGFP) expressing different chemokine receptors (Cxcr4b, Cxcr4a, Ccr9 and Ccr7) along with PTX. Merged images show the position of PGCs with respect to control (cntl), or ligand-expressing cells. (B–E) Graphs showing the quantitation of directed cell migration, by presenting the percentage of PGCs located within the ligand-expressing domains. 60 pg of mGFP-nanos was used to label PGCs in green and 40 pg of m-cherry-globin mRNA was used for labeling the ligand-expressing half of the embryo. 10 pg of PTX-encoding RNA were injected to inhibit the Gi protein. 20 pg of receptor-encoding RNA was used and 30 pg of ligand-encoding RNA was used. 0.2 pmol of cxcl12a morpholino was used. Equimolar amounts of cntl RNA were used. For raw data see Figure 5—source data 1 . |
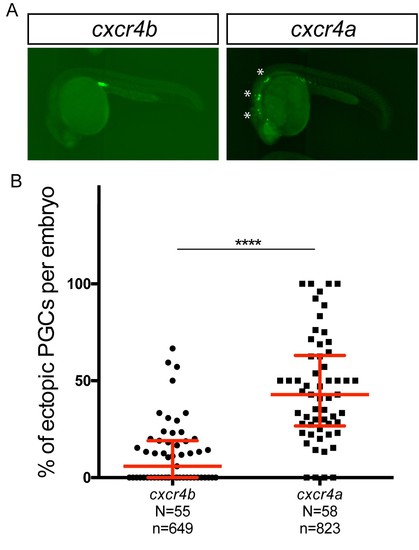
Overexpression of Cxcr4a in wild-type PGCs leads to increase in number of ectopic PGCs. (A) Wild-type embryos expressing Cxcr4b (left) or Cxcr4a (right) in their PGCs. (B) Graph showing percentage of ectopic PGCs per embryo. 80 pg of RNA encoding for either Cxcr4a or Cxcr4b was injected into the embryo. The inclusion of the nanos 3’UTR leads to preferential expression of the proteins in the PGCs. 60 pg of mGFP-nanos RNA was used to label PGCs in green. For raw data see Source data file Figure 5—figure supplement 1. |
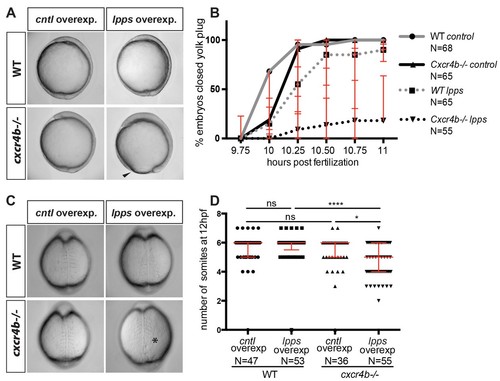
Functional compensation between G-protein-coupled receptors from different groups. (A) Brightfield images showing 10 hpf embryos overexpressing RNA encoding for LPPs (lpp1-varX1, lpp3-varX1) or control RNA. Wild-type (WT) embryos overexpressing Lpps and embryos lacking Cxcr4b function (cxcr4b-/-) developed normally. Cxcr4b-deficient embryos overexpressing Lpps exhibited a delay in gastrulation and failed to close the yolk plug. (B) Graph showing the percentage of embryos with closed yolk plug between 9.75 and 11 hpf. (C) Brightfield images of embryos at 12 hpf. WT embryos overexpressing Lpps and embryos lacking Cxcr4b function (cxcr4b-/-) developed normally and formed six somites by this stage. Embryos lacking Cxcr4b function (cxcr4b-/-) that overexpress Lpps developed only five somites that appear abnormal. (D) Graph showing the number of somites at 12 hpf in WT and cxcr4b-/- embryos expressing control or Lpps encoding RNA. 75 pg of RNA encoding each Lpp was injected. Equimolar amounts of control RNA were used. For raw data see Figure 6—source data 1. |
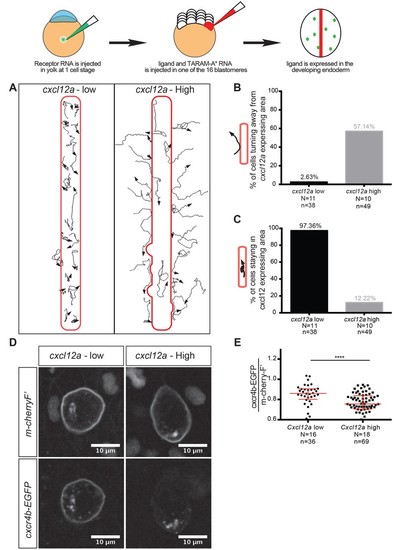
Regulation of reverse migration of PGCs by receptor internalization. (A) Tracks of PGCs with respect to domains in the embryo expressing low or high levels of Cxcl12a, in embryos lacking the endogenous ligand. PGCs migrated into domains expressing low levels of the attractant and remained within them, while the cells turned away when the domains expressed high levels of Cxcl12a. (B) Graph showing percentage of cells that moved away from the Cxcl12a expressing domains (2.6% in the case of low Cxcl12a expression and 57.1% in the case of high Cxcl12a levels). (C) Graph showing the percentage of cells that remained for 90 minutes or more within the Cxcl12a expressing area 97.4% in the case of the low expression of the chemokine and 12.2% in the case of high Cxcl12a expression). (D) High-magnification images of PGCs expressing EGFP-tagged Cxcr4b and farnesylated mCherry on their membranes. The cells interacted with low and high Cxcl12a expressing domains as in A. (E) Graph showing the level of Cxcr4b on the PGC membrane as a ratio between the EGFP signal and that of the farnesylated mCherry in cells exposed to low and high concentrations of the ligand. 20 pg of cxcr4b-nanos, 400 pg and 25 pg of cxcl12a RNA was injected to achieve high and low expression domains; 60 pg of mGFP-nanos was used to label the PGCs; 30 pg of m-cherry-H2B was used to label the cells expressing Cxcl12; and 2 pg of TARAM-A*. 101 pg of cxcr4b-EGFP-nanos was used in the receptor internalization assay and 60 pg of m-cherry-nanos was used to label the membrane of PGCs. 0.2 pmol of Cxcl12a morpholino was used. Equimolar amounts of control RNA were used. For raw data see Figure 7—source data 1. |