
- Title
-
Hippo signaling determines the number of venous pole cells that originate from the anterior lateral plate mesoderm in zebrafish
- Authors
- Fukui, H., Miyazaki, T., Chow, R.W., Ishikawa, H., Nakajima, H., Vermot, J., Mochizuki, N.
- Source
- Full text @ Elife
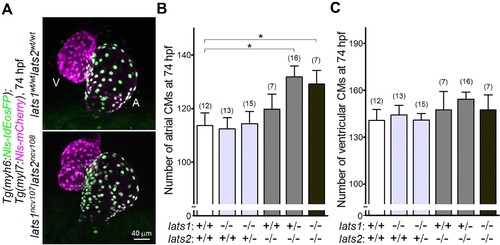
Knockout of lats1/2 genes leads to an increase in the number of atrial, but not ventricular CMs during early development. (A) Confocal 3D-stack images (at 74 hr post fertilization [hpf]) of the Tg(myh6:Nls-tdEosFP);Tg(myl7:Nls-mCherry) embryos with lats1wt/wtlats2wt/wt (top) and lats1ncv107lats2ncv108 alleles (bottom). Atrial (A) and ventricular (V) cardiomyocytes (CMs) are EosFP-positive cells and EosFP-negative mCherry-positive cells, respectively. Ventral view, anterior to the top. (B, C) Quantitative analyses of the number of atrial (B) and ventricular (C) CMs of the embryos at 74 hpf with alleles indicated at the bottom. Plus (+) and minus (–) signs indicate the wt allele and the allele of ncv107 or ncv108 in lats1 or lats2 genes, respectively. The confocal 3D-stack images are a set of representative images of eight independent experiments. In the graphs, the total number of larvae examined in the experiment is indicated on the top of columns unless otherwise described. *p < 0.05. EXPRESSION / LABELING:
PHENOTYPE:
|
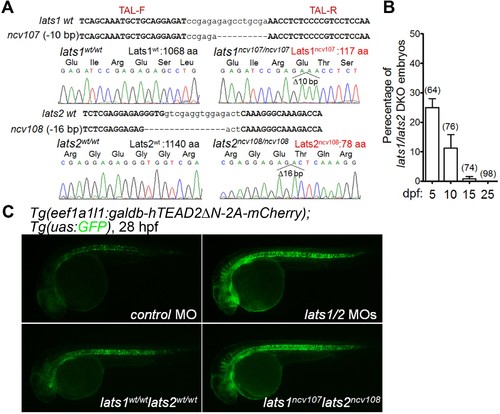
Knockout of lats1/2 genes leads to an activation of the Tead reporter. (A) lats1 and lats2 gene mutation by TALEN at the targeted loci. A deletion of 10 bp in the ncv107 allele and 16 bp in the ncv108 allele results in a premature stop codon in exon 3 of lats1 (the resulting mutant Lats1 protein consists of 117 aa) and exon 3 of lats2 (the resulting mutant Lats2 protein consists of 78 aa), respectively. Upper and lower case letters denote the target and spacer regions for the TALEN, respectively. (B) The percentages of double knockout (DKO) embryos obtained by incrossing lats1wt/ncv107lats2ncv108 fish at different days post-fertilization (dpf). The total numbers of larvae examined in the experiment are indicated at the top of each column. (C) Fluorescent images (at 28 hpf) of the Tg(eef1a1l1:galdb-hTEAD2ΔN-2A-mCherry);Tg(uas:GFP) embryos injected with control morpholino (control MO, n = 12) and lats1/2 MOs (n = 12) (upper panels), and with lats1wt/wtlats2wt/wt (n = 10) or lats1ncv107lats2ncv108 alleles (n = 7) (bottom panels). Lateral view, anterior to the left. The fluorescent images are a set of representative images from four independent experiments. |

Tead reporter expression is found in the venous pole CMs of the atrium. (A) Confocal 3D-stack images (at 74 hpf) of Tg(myl7:galdb-hTEAD2ΔN-2A-mCherry);Tg(uas:GFP) embryos (n = 6). Arrows indicate the Tead reporter GFP-positive atrial CMs. Reporter GFP image (left), mCherry image (center), and merged image of GFP and mCherry (right). A, atrium; V, ventricle. Ventral view, anterior to the top. (B) Confocal images (at 24 hpf) of the Tg(eef1a1l1:galdb-hTEAD2ΔN-2A-mCherry);Tg(uas:GFP);Tg(myl7:Nls-mCherry) embryos (n = 12). The boxed region is enlarged and shown in the panel furthest to the right. Arrows indicate the Tead reporter-positive cells that might differentiate into atrial CMs. Regions in the cardiac tube that would give rise to the atrium (A) and ventricle (V) are marked. Confocal 3D-stack images (left two panels) and single scan images (right two panels). Dorsal view, anterior to the top. The confocal 3D-stack images are a set of representative images from at least four independent experiments. |
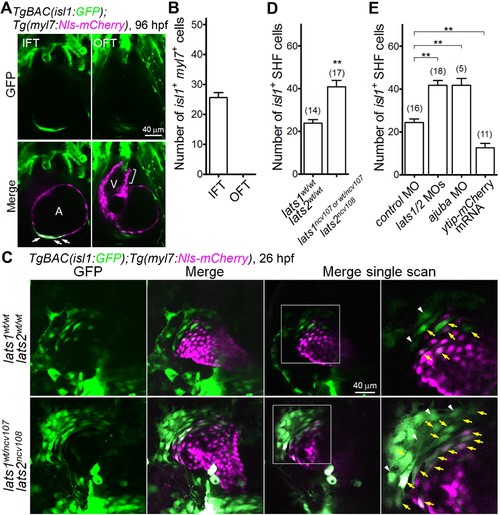
The Hippo signaling pathway is involved in the formation of Isl1-positive SHF cells in the venous pole. (A) Single-scan confocal images (at 96 hpf) of the TgBAC(isl1:GFP);Tg(myl7:Nls-mCherry) embryos. Cells in which both the isl1 and myl7 promoters are active are present in the inflow tract (IFT) cells (arrows) but not in the outflow tract (OFT) cells (square bracket). A, atrium; V, ventricle. Ventral view, anterior to the top. (B) Quantitative analyses of the number of cells with both isl1- and myl7-promoter activities in the IFT and the OFT at 96 hpf (n = 10). (C) Confocal images (at 26 hpf) of the TgBAC(isl1:GFP);Tg(myl7:Nls-mCherry) embryos with the lats1wt/wtlats2wt/wt (upper panels) or lats1wt/ncv107lats2ncv108 alleles (bottom panels). The boxed regions are enlarged in the panels in the fourth (right) column. Yellow arrows indicate both isl1- and myl7-promoter activities in cells in the venous pole. White arrowheads indicate cells with isl1-promoter activity that are in contact with cells in which there is myl7-promoter activity. Confocal 3D-stack images (left two panels) and single-scan images (right two panels). Dorsal view, anterior to the top. (D, E) Quantitative analyses of the number of the isl1-promoter-active SHF cells in the venous pole of the lats1wt/wtlats2wt/wt embryos, the lats1wt/ncv107lats2ncv108 embryos, and the lats1/2 DKO embryos (D), and in embryos shown in Figure 2—figure supplement 1D (E). Both cells with isl1- and myl7-promoter activity and with isl1-promoter activity that were in contact cells with myl7-promoter activity were counted as SHF cells. The confocal 3D-stack images and single-scan (2 μm) images are a set of representative images of at least four independent experiments. **p < 0.01. |
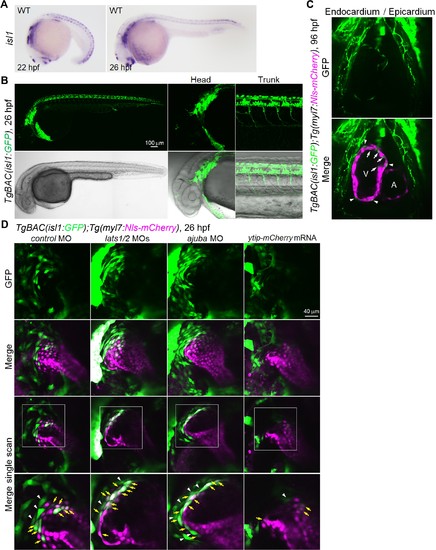
GFP expression in isl1 BAC transgenic fish recapitulates endogenous isl1 expression. (A) WISH analyses of the WT embryos at 22 hpf (left, n = 12) and 26 hpf (right, n = 14) using an antisense probe for isl1. (B) Confocal 3D-stack images (at 26 hpf) of the TgBAC(isl1:GFP) embryos (n = 7). The expression pattern of isl1 reporter GFP in the dorsal diencephalon, telencephalon, pharyngeal arch, and neural tube recapitulates endogenous isl1 mRNA expression. (C) Single-scan confocal images (at 96 hpf) of the TgBAC(isl1:GFP);Tg(myl7:Nls-mCherry) embryos (n = 10). GFP-positive mCherry-negative cells in the inside (arrows) and outside (arrowheads) of myl7-promoter-active ventricular CMs are endocardial cells and epicardial cells, respectively. A, atrium; V, ventricle. Ventral view, anterior to the top. (D) Confocal images (at 26 hpf) of TgBAC(isl1:GFP);Tg(myl7:Nls-mCherry) embryos injected with MO and mRNA. The boxed regions are enlarged in the bottom panels. Yellow arrows indicate both isl1- and myl7-promoter-active cells in the venous pole. White arrowheads indicate the isl1-promoter-active cells that are in contact with myl7-promoter-active cells. Confocal 3D-stack images (upper two panels) and single-scan images (bottom two panels). Dorsal view, anterior to the top. The confocal 3D-stack images and single-scan images are a set of representative images from at least three independent experiments. |
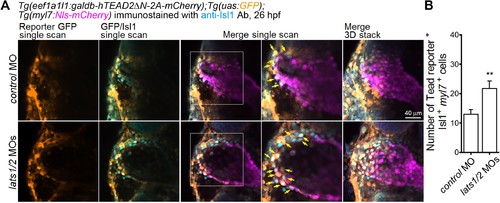
Depletion of Lats1/2 leads to an increase in the number of both Tead-reporter and Isl1-positive SHF cells in the venous pole. (A) Confocal images (at 26 hpf) of Tg(eef1a1l1:galdb-hTEAD2ΔN-2A-mCherry);Tg(uas:GFP);Tg(myl7:Nls-mCherry) embryos injected with the MOs indicated on the left and immunostained with the anti-Isl1 Ab. The boxed regions in the center panels are enlarged in the next right panels. Tead reporter-dependent GFP-positive cells in the Isl1-positive myl7-promoter-active cells (yellow arrows) are observed in the venous pole. Confocal 3D-stack images (the panels furthest to the right) and single scan images (left four columns). Dorsal view, anterior to the top. (B) Quantitative analyses of the numbers of Isl1-positive myl7-promoter-active cells that are positive for Tead-reporter-dependent GFP in the venous pole of (A) (n = 5). **p < 0.01. The confocal 3D-stack images and single-scan images are a set of representative images from three independent experiments. |

Knockout of lats1/2 results in an increase in the number of cells in the venous pole in which both myl7 and hand2 promoters are activated. (A) Quantitative-PCR analyses of the expression of nkx2.5, hand2, and gata4 mRNAs in the whole embryos at 24 hpf showing the effects of MO injection (n = 4). Relative expression of mRNA in the MO-injected morphants to that of the control is shown. (B) WISH analyses at 22 hpf of lats1wt/wtlats2wt/wt (n = 7), lats1wt/ncv107lats2wt/ncv108 (n = 22), lats1wt/ncv107lats2ncv108 (n = 14) and lats1ncv107lats2ncv108 (n = 6) embryos using an antisense probe for hand2. (C) Confocal 3D-stack images (at 26 hpf) of TgBAC(hand2:GFP);Tg(myl7:Nls-mCherry)-labeled embryos carrying the lats1wt/wtlats2wt/wt (upper panels) or lats1ncv107lats2ncv108 allele (bottom panels). GFP images (left), merged GFP and mCherry images (center), and enlarged images of the boxed regions in the center panels (right) are shown. (D) Quantitative analysis of the number of cells in which both hand2 and myl7 promoters are activated at 26 hpf. (E) Confocal 3D-stack images (at 26 hpf) of the TgBAC(hand2:GFP);Tg(myl7:Nls-mCherry)-labeled embryos containing the lats1wt/wtlats2wt/wt (upper panels, n = 9) or the lats1ncv107lats2ncv108 allele (bottom panels, n = 5) immunostained with the anti-Isl1 antibody (anti-Isl1 Ab). Square brackets denote the SHF cells that are Isl1-positive, both hand2- and myl7-promoter-active cells that are Isl1-positive, and hand2-promoter-active cells that are in contact with myl7-promoter-active cells. pp indicates the pharyngeal pouch, which expresses the hand2-promoter-activated GFP signal. The first, second, third and fourth columns show Isl1 immunostaining, merged images of GFP and Isl1 immunostaining, merged images of Isl1 immunostaining and mCherry labeling, and merged images of all the three (GFP, mCherry, and Isl1 immunostaining), respectively. All of the images are of the dorsal view, anterior to the top. The confocal 3D-stack images and the WISH images are a set of representative images from at least four independent experiments. **p < 0.01. EXPRESSION / LABELING:
PHENOTYPE:
|
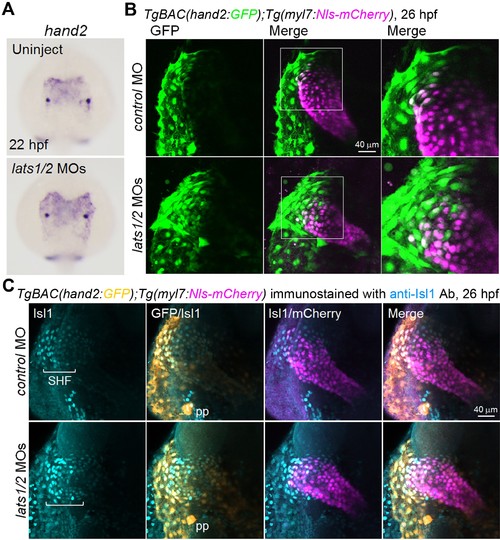
Depletion of Lats1/2 results in an increase in the number of hand2-promoter-active cells in the venous pole. (A) WISH analyses at 22 hpf of the control embryos (uninjected, n = 48) and embryos injected with lats1/2 MOs (n = 76) using an antisense probe for hand2. (B) 3D confocal stack images (at 26 hpf) of the TgBAC(hand2:GFP);Tg(myl7:Nls-mCherry) embryos injected with control MO (n = 12) and lats1/2 MOs (n = 16). GFP images (left), merged GFP and mCherry images (center), and enlarged images of the boxed regions in the center panels (right). Dorsal view, anterior to the top. Images are a set of representative images from eight independent experiments. (C) Confocal 3D-stack images (at 26 hpf) of the TgBAC(hand2:GFP);Tg(myl7:Nls-mCherry) embryos injected with the MOs indicated on the left and immunostained with the anti-Isl1 Ab (control MO, n = 15; lats1/2 MOs, n = 21). Square brackets denote the SHF cells that are Isl1-positive. The first, second, third and fourth images are Isl1 immunostaining, the merged GFP and Isl1 immunostaining image, the merged Isl1 immunostaining and mCherry image, and the merged image for all the three labels (GFP, mCherry, and Isl1 immunostaining), respectively. pp indicates the pharyngeal pouch, which expresses hand2-promoter-activated GFP signals. Dorsal view, anterior to the top. The images are a set of representative images for three independent experiments. |
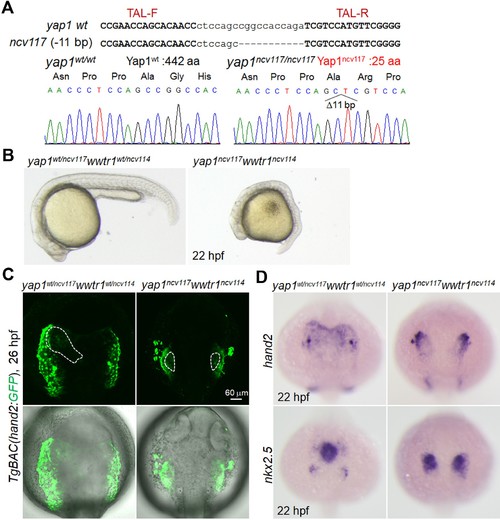
hand2-promoter-active cells were significantly decreased in yap1/wwtr1 double-knockout embryos. (A) yap1 gene mutation by TALEN at the targeted loci. A deletion of 11 bp in the ncv117 allele results in a premature stop codon in exon 1 of yap1 (the resulting mutant Yap1 protein consists of 25 aa). Upper and lower case letters denote the target and spacer regions for the TALEN, respectively. (B) Bright field images of a yap1wt/ncv117wwtr1wt/ncv114 embryo (n = 4) and a yap1ncv117wwtr1ncv114 embryo (n = 4) at 22 hpf. Lateral view. (C) Confocal 3D-stack images (at 26 hpf) of the TgBAC(hand2:GFP) embryos with the yap1wt/ncv117wwtr1wt/ncv114 allele (left panels, n = 8) and the yap1ncv117wwtr1ncv114 allele (right panels, n = 9). Dotted lines indicate the heart region. Note that the number of hand2-promoter-active cells is decreased in yap1ncv117wwtr1ncv114 embryos. (D) WISH analyses of yap1wt/ncv117wwtr1wt/ncv114 (left panels) and yap1ncv117wwtr1ncv114 (right panels) embryos at 22 hpf, made using antisense probes for hand2 (upper panels, n = 4–7) and nkx2.5 (lower panels, n = 4 to 6). The confocal 3D-stack images are a set of representative images from three independent experiments. |

Tead-reporter-active cells in the caudal region of the ALPM move to the venous pole. (A) Time-sequential 3D-rendered confocal images of the TgBAC(hand2:GFP) embryo from 15.5 hpf to 25.5 hpf (n = 6). Spots of magenta and cyan denote the cells in the caudal part of the left and right ALPM, respectively. Notochord, nc; cardiac disc, cd; cardiac tube, ct. ALPM, cd, and ct are indicated by the blue, yellow, and red broken lines, respectively. (B) Tracking of caudal end hand2-promoter-active ALPM cells from 14 hpf to 26 hpf. The 3D-rendered confocal image of the TgBAC(hand2:GFP) embryo at 26 hpf with the track of cells showing color changes from blue to red according to the time after imaging (14 hpf to 26 hpf). (C) Schematic illustration of the trajectory patterns of the caudal end ALPM cells from 14 hpf to 26 hpf. Magenta and cyan denote the caudal region of the left and right ALPM, respectively. The cells in the caudal region of the left ALPM (magenta) and the right ALPM (cyan) moved to the venous pole (26 hpf) through the SHF region posterior to the cd (20 hpf). (D) Confocal 3D-stack images of the Tg(myl7:EGFP) embryo injected with pTol2-hand2 BAC:tdEosFP at the 12 somite stage (ss) (upper panels) and at 52 hpf (lower panels). Cells from the caudal region of either left ALPM (left four panels, n = 19) or right ALPM (right four panels, n = 18) were photoconverted at 12 ss. The hearts of the photoconverted embryos were imaged at 52 hpf. White squares and white lines indicate the photoconverted area and the outline of the heart, respectively. (E) Confocal 3D-stack images (at 12 ss) of the TgBAC(hand2:GFP);Tg(eef1a1l1:galdb-hTEAD2ΔN-2A-mCherry);Tg(uas:mRFP1) embryo (n = 6). Tead-reporter-active cells were present in the entire ALPM. Images of the ALPM are in dorsal view, anterior to the top. Images of the heart are in ventral view, anterior to the top. The confocal 3D-stack images are a set of representative images from at least five independent experiments. EXPRESSION / LABELING:
|
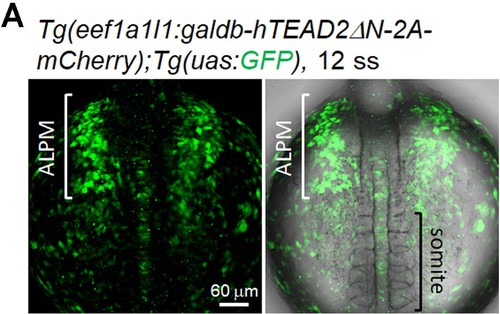
The Tead reporter is expressed in the ALPM but not in the rostral region of the PLPM. (A) Confocal 3D-stack images of the Tg(eef1a1l1:galdb-hTEAD2ΔN-2A-mCherry);Tg(uas:GFP) embryo at 12 ss (n = 5). Note that the Tead reporter is expressed in the ALPM but not in the outside of somites corresponding to the PLPM. White and black brackets indicate the ALPM and the somite, respectively. The confocal 3D-stack image is a set of representative images from three independent experiments. |
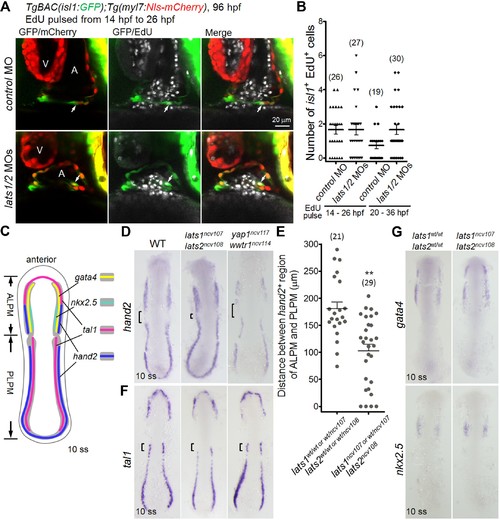
Knockout of lats1/2 leads to an increase in the expression of hand2 in the boundary between ALPM and PLPM. (A) Single-scan confocal images (at 96 hpf) of the TgBAC(isl1:GFP);Tg(myl7:Nls-mCherry) embryos injected with MO and pulsed with EdU from 14 hpf to 26 hpf. Arrows indicate the EdU-incorporated isl1- and myl7-promoter-active cells in the IFT of the atrium. A, atrium; V, ventricle. Ventral view, anterior to the top. (B) The number of EdU-positive isl1-promoter-active CMs among the embryos treated with MO. Embryos pulsed with EdU from 14 hpf to 26 hpf (left two columns) and from 20 hpf to 36 hpf (right two columns). (C) Schematic illustration of gene expression patterns in the LPM of wildtype (WT) embryos at 10 somite stage (ss). Expression domain of tal1, gata4, nkx2.5 and hand2 are depicted as magenta, yellow, green, and blue, respectively. Dorsal view, anterior to the top. (D, F, G) WISH analyses of the embryos at 10 ss using the antisense probes indicated to the left of the panels. (D, F) Genotypes are WT (left panels, n = 8 to 18), lats1/2 DKO (center panels, n = 6 to 13), and yap1/wwtr1 DKO (right panels, n = 5 to 7). (D) Square brackets indicate the gap between hand2-positive regions of ALPM and PLPM. (E) Quantitative measurement of the distance indicated by the brackets in (D) in either the lats1wt/wtlats2wt/wt embryos or the lats1 wt/ncv107lats2 wt/ncv108 embryos and in either the lats1wt/ncv107lats2ncv108 or the lats1/2 DKO embryos. (F) Brackets indicate the tal1-positive rostral end of PLPM in the WT. (G) Genotypes are WT (left panels, n = 4 to 5) and lats1/2 DKO (right panels, n = 3 to 4). Dorsal view, anterior to the top. The single-scan (2 μm) confocal images and in situ hybridization (ISH) images are a set of representative images of at least four independent experiments. **p < 0.01. EXPRESSION / LABELING:
PHENOTYPE:
|
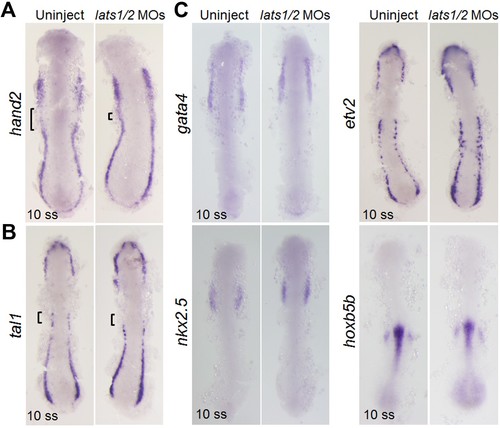
Depletion of Lats1/2 leads to an increase in the expression of hand2. (A–C) WISH analyses of control embryos (uninjected, left panels, n = 16 to 31) and embryos injected with lats1/2 MOs (right panels, n = 20 to 32) using the antisense probes indicated to the left of the panels at the 10 ss. (A) Square brackets indicate the gap between the hand2-positive regions of the ALPM and the PLPM. Note that the gap is absent in the lats1/2 morphants. (B) Square brackets indicate the presence of tal1 in the rostral end of the PLPM in the control embryos (left), whereas square brackets indicate the absence of tal1 in the lats1/2 morphants (right). (C) Comparable expression of gata4, etv2, nkx2.5, and hoxb5b in control embryos (left panels) and lats1/2 morphants (right panels) at 10 ss. Dorsal view, anterior to the top. WISH images are a set of representative images from four independent experiments. |
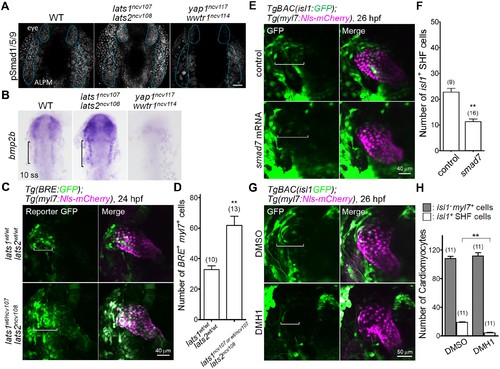
The Hippo signaling pathway functions upstream of the Bmp-dependent signal that is necessary for Isl1-positive SHF formation. (A) Confocal 3D-stack images (at 14 hpf) of embryos immunostained with the anti-pSmad1/5/9 Ab. Blue broken lines indicate the phosphorylated Smad1/5/9-positive cells in the ALPM and eyes. Note that the pSmad1/5/9-positive signals in the ALPM and the eyes are increased and decreased in the embryos of lats1/2 DKO and yap1/wwtr1 DKO, respectively (n = 3). Scale bar indicates 60 μm. (B) WISH analyses at the 10 somite stage (ss) of WT (n = 9), lats1/2 DKO (n = 10), and yap1/wwtr1 DKO (n = 8) embryos, using antisense probe for bmp2b. Square brackets indicate the bmp2b-positive ALPM. (C) Confocal 3D-stack images (at 24 hpf) of the Tg(BRE:GFP);Tg(myl7:Nls-mCherry) embryos carrying lats1wt/wtlats2wt/wt (upper panels) and lats1wt/ncv107lats2ncv108 alleles (bottom panels). Square brackets highlight the GFP-positive myl7-promoter-active cells in the venous pole. Note that the numbers of GFP-positive myl7-promoter-active cells are increased in the venous pole. (D) Quantitative analyses of the numbers of the both BRE-active GFP-positive and myl7-promoter-active mCherry-positive cells in the lats1wt/wtlats2wt/wt embryos and in either the lats1wt/ncv107lats2ncv108 embryos or the lats1/2 DKO embryos. (E) Confocal 3D-stack images (at 26 hpf) of the TgBAC(isl1:GFP);Tg(myl7:Nls-mCherry) control embryos (uninjected, upper panels) and embryos injected with 100 pg of smad7 mRNA (bottom panels). Square brackets indicate the region of isl1-promoter-active GFP-positive SHF cells in the venous pole. (F) Quantitative analyses of the number of isl1-promoter-active SHF cells in the venous pole. Note that overexpression of smad7 mRNA leads to a decrease in the number of isl1-promoter-active SHF cells in the venous pole. (G) Confocal 3D-stack images (at 26 hpf) of the TgBAC(isl1:GFP);Tg(myl7:Nls-mCherry) embryos treated with DMSO (upper panels) or DMH1 (10 μM, lower panels) constructed between 14 hpf and 26 hpf. Square brackets indicate the isl1-promoter-active SHF cells in the venous pole. (H) Quantitative analyses of the number of isl1-promoter-active SHF cells and of the number of both GFP-negative and myl7-promoter-active mCherry-positive cells. Note that DMH1 treatment decreases the number of isl1-promoter-active SHF cells in the venous pole but does not affect the number of GFP-negative and myl7-promoter-active CMs. All images in this figure are in dorsal view, anterior to the top. The confocal 3D-stack images and ISH images are a set of representative images of at least three independent experiments. **p < 0.01. EXPRESSION / LABELING:
PHENOTYPE:
|
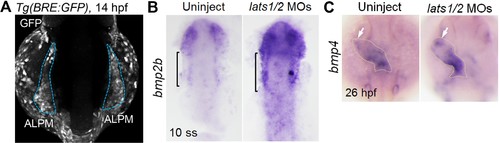
Depletion of Lats1/2 leads to an increase in bmps expression. (A) Confocal 3D-stack image of the Tg(BRE:GFP) embryo at 14 hpf (n = 6). Blue broken lines indicate the GFP-positive ALPM. (B, C) WISH analyses at 10 ss (B) and 26 hpf (C) of uninjected control embryos (left panels, n = 15 to 22) and embryos injected with lats1/2 MOs (right panels, n = 19 to 23) made using antisense probes for bmp2b (B) and bmp4 (C). (B) Square brackets indicate the bmp2b-positive ALPM. Note that expression of bmp2b is increased in the lats1/2 morphants. (C) Arrows indicate the bmp4-positive cells in the venous pole. Broken lines indicate the cardiac tube. The confocal 3D-stack image and WISH images are a set of representative images from at least three independent experiments. |
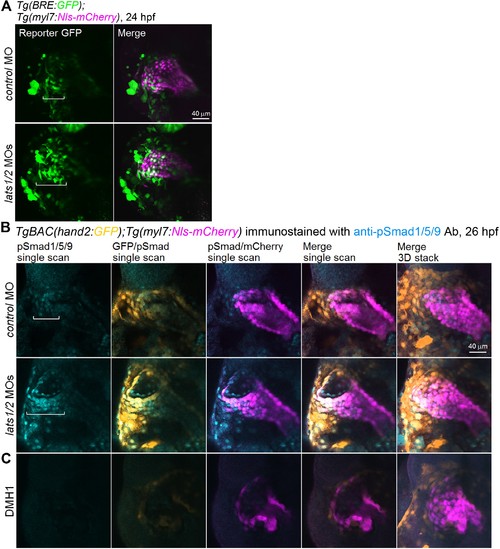
Depletion of Lats1/2 leads to an activation of Bmp-Smad signaling. (A) Confocal 3D-stack images (at 24 hpf) of Tg(BRE:GFP);Tg(myl7:Nls-mCherry) embryos injected with control MO (n = 11) and lats1/2 MOs (n = 12). Square brackets indicate the region in which BRE-dependent GFP-positive myl7-promoter-active cells are present in the venous pole. (B) Confocal images (at 26 hpf) of TgBAC(hand2:GFP);Tg(myl7:Nls-mCherry) embryos injected with control MO (n = 16) or lats1/2 MOs (n = 14). Square brackets indicate the phosphorylated Smad1/5/9-positive myl7-promoter-active cells in the venous pole. Confocal 3D-stack images (the most-right panels) and single scan images (left four panels). (C) Images of TgBAC(hand2:GFP);Tg(myl7:Nls-mCherry) embryos treated with DMH1 (10 μM) from 14 hpf to 26 hpf (n = 6) and immunostained with the anti-pSmad1/5/9 Ab. Both pSmad1/5/9-positive and hand2-promoter-active cells in the venous pole are decreased in the embryos treated with DMH1. (B,C) Dorsal view, anterior to the top. The confocal 3D-stack images and single-scan images are a set of representative images from at least three independent experiments. |
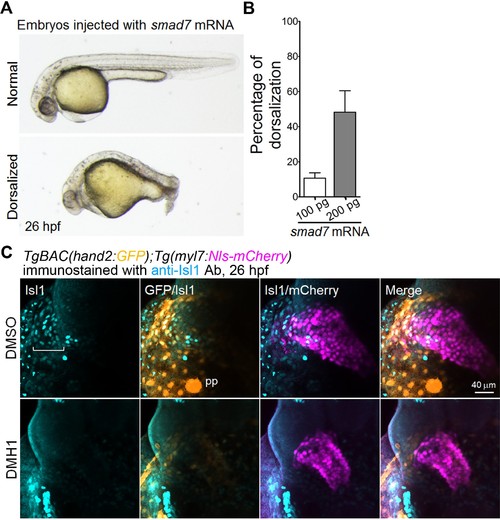
Suppression of Bmp-Smad signaling results in a decrease in the number of Isl1-positive SHF cells in the venous pole. (A) Bright-field images of embryos injected with smad7 mRNA (100 pg) at 26 hpf. The normal dorso-ventral formation (upper panel) is compared with the impaired dorso-ventral formation in the embryos injected with smad7 mRNA (lower panel). (B) Quantitative analyses of the percentage of enhanced dorsalization of the embryos injected with 100 pg or 200 pg of smad7 mRNA (n = 5). (C) Confocal 3D-stack images (at 26 hpf) of TgBAC(hand2:GFP);Tg(myl7:Nls-mCherry) embryos treated with DMSO (upper panels, n = 6) or DMH1 (10 μM, bottom panels, n = 9) from 14 hpf to 26 hpf and immunostained with the anti-Isl1 Ab. Square brackets indicate Isl1-positive cells in the venous pole. Note that both hand2- and myl7-promoter-active and Isl1-positive cells in the venous pole are absent in the embryos treated with DMH1. The confocal 3D-stack images are a set of representative images from at least three independent experiments. |