
- Title
-
Continuous addition of progenitors forms the cardiac ventricle in zebrafish
- Authors
- Felker, A., Prummel, K.D., Merks, A.M., Mickoleit, M., Brombacher, E.C., Huisken, J., Panáková, D., Mosimann, C.
- Source
- Full text @ Nat. Commun.
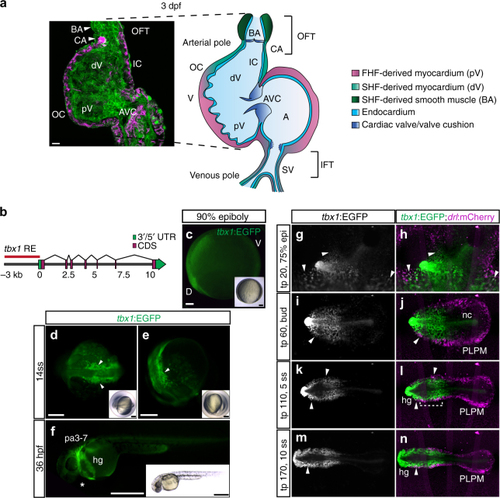
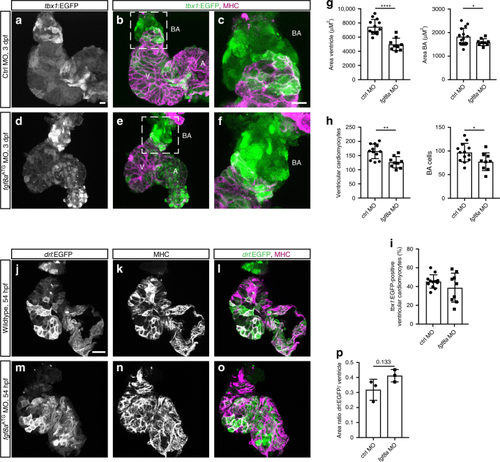
|

|

A |

|
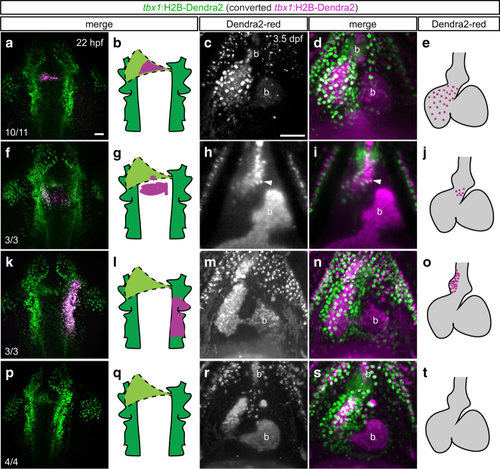
The |
|
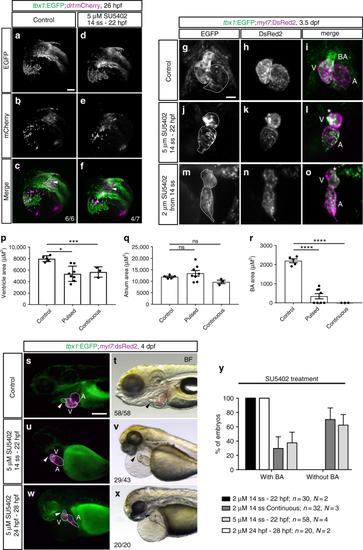
FGF signaling differentially affects |