
- Title
-
Oncostatin M and Kit-Ligand Control Hematopoietic Stem Cell Fate during Zebrafish Embryogenesis
- Authors
- Mahony, C.B., Pasche, C., Bertrand, J.Y.
- Source
- Full text @ Stem Cell Reports
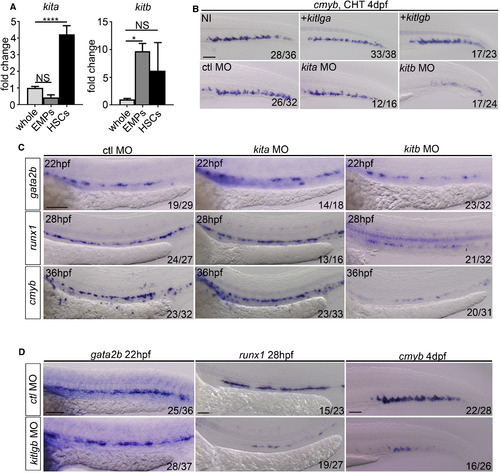
kitb, but Not kita, Signaling Is Necessary for Correct HSC Specification (A) qPCR expression of kita and kitb in FACS-sorted hematopoietic progenitors. Kita whole and EMPS, p = 0.14. kita whole and HSCs, p < 0.0001. kitb whole and EMPs, p = 0.023. kitb whole and HSCs, p = 0.14. EMPs: double-positive lmo2:eGFP, gata1:DsRed cells (28 hpf) (Bertrand et al., 2007). HSCs: double-positive flk1:mCherry, cmyb:eGFP cells (36 hpf) (Bertrand et al., 2010). Data are from biological triplicates. Data are means ± SD. (B) cmyb ISH at 4dpf in non-injected control (NI), kitlga (injected at 500 pg throughout, unless stated) or kitlgb (injected at 200 pg throughout, unless stated) mRNA injected embryos. cmyb was socred at 4dpf following ctrl-MO, kita-MO (injectedat 3 ng throughout, unless stated) or kitb-MO (injected at 8 ng throughout, unless stated) injection. NI, non-injected control. +kitlga/kitlgb, kitlga/kitlgb full length mRNA injected embryos. (C) Control-MO, kita-MO and kitb-MO injected embryos were scored for the expression of gata2b, runx1 and cmyb at 22 hpf, 28 hpf and 36 hpf, respectively. (D) kitlgb morphants were scored for gata2b, runx1 and cmyb at 22 hpf, 28 hpf and 4 dpf, respectively. Analysis was completed using ordinary one way ANOVA with multiple comparisons. **** p < 0.0001; *p < 0.05; NS, p > 0.05. All scale bars, 100 µm. EXPRESSION / LABELING:
|
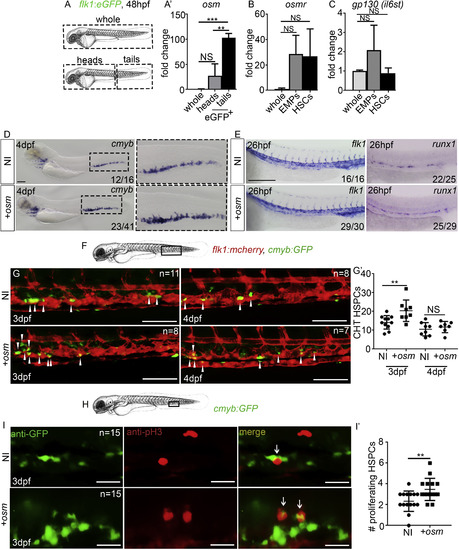
osm Expands HSCs within the CHT Niche (A and A′) Experimental outline and qPCR expression of osm from whole zebrafish or FACS-sorted ECs. Data are biological triplicates plated in technical duplicates. (B and C) qPCR expression of osm, osmr, and gp130 (il6st in zebrafish) in whole zebrafish or FACS-sorted hematopoietic progenitors (EMPs and HSCs). All qPCR data are from biological triplicates. In (A′), (B), and (C), analysis was performed by a one-way ANOVA with multiple comparisons. In (A′), whole and heads, p = 0.16; whole and tails, p = 0.0004; heads and tails, p = 0.0019. In (B), whole and EMPs, p = 0.17; whole and HSCs, p = 0.14. In (C), whole and EMPs, p = 0.22; whole and HSCs, p = 0.98. (D and E) ISH expression of cmyb, flk1, and runx1 following injection of full-length osm mRNA (injected at 300 pg here and throughout, unless otherwise stated) or in non-injected embryos. Scale bar, 100 μm. (F) Imaging area. (G and G′) Imaging double transgenic flk1:mCherry/cmyb:GFP embryos at 3 and 4 dpf. Arrowheads represent HSCs embedded in the CHT niche. Scale bar, 100 μm. In (G′), between NI and osm injected at 3 dpf, p = 0.0097, and at 4 dpf, p = 0.4894. (H) Imaging area. (I and I′) anti-GFP and pH3 immunofluorescence at 3 dpf in cmyb:eGFP embryos. Arrows represent double-positive, proliferating cells. Scale bar, 25 μm. Analysis was performed by an unpaired, two-tailed Student's t test in (G′) and (I′). In (I′), p = 0.0050. NI, non-injected control. +osm, osm full-length mRNA-injected embryos. All data are means ± SD ∗∗∗p < 0.001, ∗∗p < 0.01, NS, p > 0.05. |
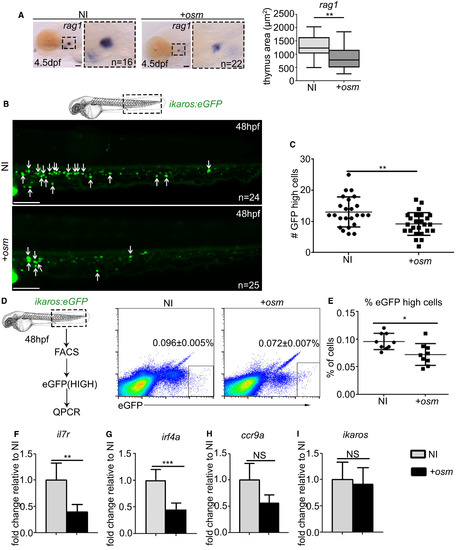
osm Inhibits Lymphocyte Priming and Differentiation by Repressing Lymphoid Gene Expression (A) ISH at 4.5 dpf of rag1 thymus staining with quantification of thymus area, where p = 0.0087. Scale, 50 μm. (B) Live imaging of CHT region in ikaros:eGFP embryos at 48 hpf. Each arrow indicates a single ikaros:eGFPhigh cell. Scale, 100 μm. (C) Quantification of the number of ikaros:eGFPhigh cells at 48 hpf, p = 0.0028. (D) FACS sorting and analysis of ikaros:eGFPhigh cells at 48 hpf (p = 0.0112). Values indicated on FACS plots are mean ± SEM, graphs are means ± SD. (E) Quantification of ikaros:eGFPhigh cells. (F–I) qPCR analysis of il7r (F) (p = 0.0017), irf4a (G) (p = 0.0001), ccr9a (H) (p = 0.1265), and ikaros (I) (p = 0.8030) expression in ikaros:eGFPhigh cells FACS sorted at 48 hpf. qPCR data shown are the mean ± SEM of three data points, calculated from three independent experiments. Each separate experiment was conducted in biological triplicates, then averaged to give a single value. NI, non-injected control. +osm, osm full-length mRNA-injected embryos. Statistical analysis was completed using an unpaired, two-tailed Student's t test. ∗∗∗p < 0.001; ∗∗p < 0.01; ∗p < 0.05; NS, p > 0.05. |

osmr Signaling Is Necessary for HSC Specification (A) gata2b, runx1, and cmyb ISH in control MO, or osmr MO-injected embryos (injected at 4 ng throughout, unless stated). Scale bar, 100 μm. ctl, control. (B) ISH expression of cmyb, in control MO, or osmr MO-injected embryos. Scale bar, 100 μm. (C) rag1 expression in the thymus after control MO or osmr MO injection, along with quantification of thymus area. Data are box and whiskers, min to max. Scale bar, 50 μm. (D) gata2b, runx1, and cmyb ISH in control MO, or osm MO (injected at 7 ng throughout, unless stated)-injected embryos. Scale bar, 100 μm. Data are boxes and whiskers, min to max. Statistical analysis was completed using an unpaired, two-tailed Student's t test. ∗∗∗∗p < 0.0001. EXPRESSION / LABELING:
PHENOTYPE:
|

osm and kitlgb Signal Synergistically to Expand HSCs in the CHT (A) runx1 ISH at 28 hpf in NI embryos and kitlgb or osm mRNA-injected embryos (injected separately and together) at subliminal doses. Scale bar, 100 μm. (B) cmyb ISH at 4 dpf in NI embryos and kitlgb or osm mRNA-injected embryos (injected separately and together) at subliminal doses. Scale bar, 100 μm. (B′) cmyb expression analysis. Analysis is Fisher's exact test. NI versus kitlgb, p = 0.29; NI versus osm, p = 0.48; NI versus kitlgb + osm, p = 0.0001. (C) Imaging schematic. (D) Immunofluorescence for GFP and pH3. Arrows represent double-positive, proliferating cells. Scale, 25 μm. (D′) Quantification of double-positive cells. (D′) Data are means ± SD and analysis is an ordinary one-way ANOVA with multiple comparisons. ANOVA p value = 0.0082. ∗∗∗p < 0.001; ∗∗p < 0.01; NS, p > 0.05. |

Inhibition of osmr and kitb Signaling Synergistically Inhibits HSC Specification (A) runx1 (28 hpf) ISH following control MO, osmr MO, or kitb MO injection (separately and together) at subliminal doses (half doses). ctl, control. (B) cmyb ISH at 4 dpf following control MO, osmr MO, or kitb MO injection (separately and together) at subliminal doses (half doses). (B′) Quantification of the results observed in panel (B). High cmybsignal (black), medium cmyb signal (grey) and low cmyb signal (white). Analysis was generated by Fisher’s exact test. NI versus kitb-MO; p = 0.082, NI versus osmr-MO; p = 0.0089, NI versus kitb+osmr-MOs; p = 0.0000009. (C) Summary. Aortic ECs transition to “HE/pro HSC” by expressing gata2b, a process that requires osm/osmr signaling. HSCs then begin to bud from the aorta and begin to express runx1 to become “pre HSCs”, a process that requires kitlgb/kitb signaling. HSC then become “HSCs” and express cmyb. HSCs migrate to the CHT and can either proliferate (prolif.) or differentiate (diff.) in response to cytokines expressed by caudal ECs (cECs). Some will differentiate to lymphoid lineages. Proliferation of HSCs is enhanced by osm and differentiation to lymphoid lineages is inhibited. HSC proliferation is also synergistically enhanced by both kitlgb and osm signaling through their receptors. ∗∗∗∗p < 0.0001; ∗∗p < 0.01. All scale bars, 100 μm. HE, hemogenic endothelium. |
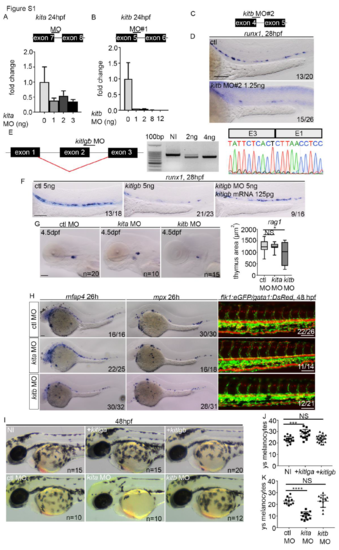
MO validation and knockdown of kita, kitb and kitlgb. (A, B) Schematic of splice blocking MO targeting intron/exon junctions in kita and kitb (schematics are not to scale), along with qPCR analysis of kita and kitb expression after MO injection at different concentrations. Data is mean±SD. cDNA was synthesised from total RNA extracted at 24hpf from a pool of 6-10 embryos. (C) Schematic of second splice blocking MO targeting intron/exon junctions in kitb. (D) ISH to examine runx1 (28hpf) expression. runx1 was reduced in a similar manner as in embryos injected with kitb MO#1. kitb MO#2 was only used here, all other data uses kitb MO#1 (herein referred to as kitb MO). (E) Validation of kitlgb MO that induces exon skipping (confirmed by cDNA synthesis at 24hpf from pools of 6-10 embryos, then sequencing PCR product using reverse primer). (F) kitlgb morphants have reduced runx1 (28hpf) expression, which is rescued by injecting full length mRNA for kitlgb. (G) rag1 expression following MO injection. (H) ISH to examine macrophages (mfap4 expression) and neutrophils (mpx expression). Flk1:eGFP/gata1:DsRed embryos were used to examine blood flow and endothelial cell formation. (I-K) Analysis of the number of pigments on the left side of the yolk sack region in either MO or mRNA injected embryos at 48hpf. NI, non-injected control. +kitlga/+kitlgb, kitlga/kitlgb full length mRNA injected embryos. All data represents mean±SD. Statistical analysis completed using ordinary one-way ANOVA with multiple comparisons. In A, p=0.0008. In D, p=0.0002. In E, p value is less than 0.0001. ****, p<0.0001. ***, p<0.001. *, p<0.05. NS, p>0.05. ys, yolk sack. All scale bars Scale bars are 100μm, except G, where scale bar is 50μm. |

osm expression is tfec-dependent and reduces macrophage differentiation. (A) qPCR analysis of osm expression in FACS sorted tail endothelial cells from flk1:eGFP at 48hpf from non-injected or embryos injected with tfec mRNA. qPCR data shown is the mean±SEM of three data points, calculated from three independent experiments. Each separate experiment was conducted in biological triplicates, then averaged to give a single value. (B) ISH analysis of cmyb expression in non-injected or osm injected siblings (Sib.) and tfec mutants. (B’) analysis of cmyb expression within the CHT. (C) Experimental outline. (D) qPCR analysis of runx1 (p=0.5441), gata3 (p=0.9650) and cmyb (p=0.0981) expression in ikaros:eGFPhigh cells FACS sorted at 48hpf. qPCR data shown is the mean±SEM of three data points, calculated from three independent experiments. Each separate experiment was conducted in biological triplicates, then averaged to give a single value. NI, non-injected control. +osm, osm full length mRNA injected embryos. Statistical analysis was completed using an unpaired, two-tailed Student's t-test. NS, p>0.05. (E-G) ISH analysis of mpx, mfap4, gata1 at 4dpf in NI or osm injected embryos. NI, non-injected control. +osm, osm full length mRNA injected embryos. All scale bars are 100μm. |
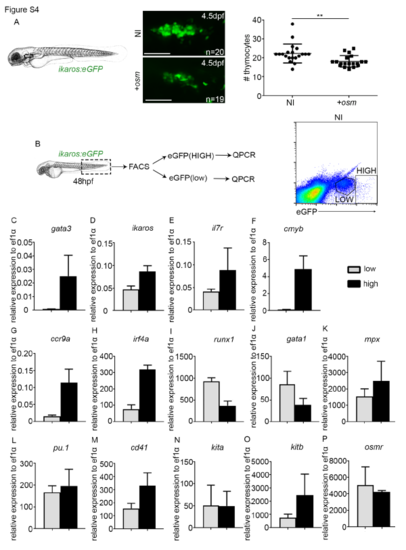
Characterisation of ikaroshigh and ikaroslow population. (A) Thymus imaging in ikaros:eGFP 4.5dpf embryos. P=0.0031. Scale, 50μm. NI, non-injected control. +osm, osm full length mRNA injected embryos. (B) FACS sorting of ikaros:eGFPlow and ikaros:eGFPhigh cells at 48hpf from non-injected embryos. (C-P) qPCR analysis of gene expression in the low and high population. Data represented is mean±SD from biological triplicates, except in runx1, gata1 and osmr ikaros:eGFPhigh where data is biological duplicates. Statistical analysis was completed using an unpaired, two-tailed Student's t-test. ** p<0.01. |
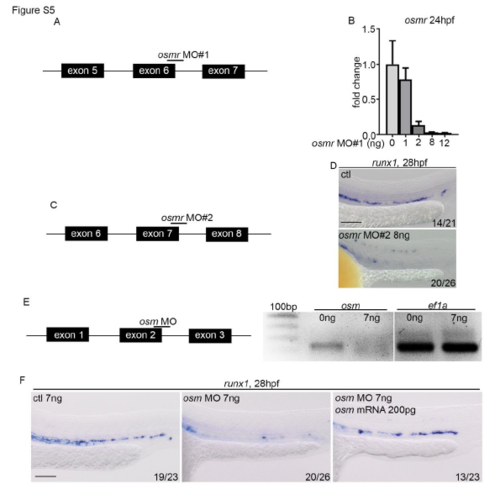
Validation of MOs for osmr and osm. (A) Schematic of splice blocking MO targeting exon/intron junction in osmr. Schematic is not to scale. (B) qPCR analysis of osmr expression after osmr MO injection at different concentrations. Data is mean±SD. cDNA was synthesised from total RNA extracted from 24hpf embryos. (C) Schematic of second splice blocking MO targeting intron/exon junctions in osmr. (D) ISH to examine runx1 (28hpf) expression. runx1 was reduced in a similar manner as in embryos injected with osmr MO#1. osmr MO#2 was only used here, all other data uses osmr MO#1 (herein referred to as osmr MO). (E) Validation of osm MO. (F) osm morphants have reduced runx1 (28hpf) expression, which is rescued by injecting full length mRNA for osm. All scale bars are 100μm. |

osmr morphants have reduced primitive erythropoiesis but normal primitive myelopoiesis. (A) flk1, flt4 and dlc ISH expression at 28hpf in control or osmr morphants (B) gata1 ISH expression at 22hpf in control or osmr morphants. (C) O-dianisadine staining at 48hpf in control or osmr morphants. (D) Representative images of double transgenic flk1:eGFP/gata1:DsRed embryos injected with control or osmr morphants at 48hpf. (E) ISH analysis of macrophages (mfap expression) and neutrophils (mpx expression). All scale bars are 100μm. EXPRESSION / LABELING:
PHENOTYPE:
|