
- Title
-
The Hippo pathway effector Wwtr1 regulates cardiac wall maturation in zebrafish
- Authors
- Lai, J.K.H., Collins, M.M., Uribe, V., Jiménez-Amilburu, V., Günther, S., Maischein, H.M., Stainier, D.Y.R.
- Source
- Full text @ Development
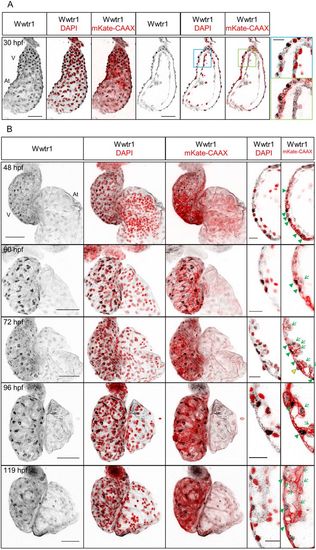
Expression and localization of Wwtr1 in the developing zebrafish heart. (A) Maximum intensity projections and confocal sagittal sections of a whole-mount zebrafish heart at 30 hpf. Magnified images (blue and green squares) show that the nuclei of cardiomyocytes, but not of endocardial cells, are positive for Wwtr1 expression. (B) Maximum intensity projections and confocal sagittal sections of whole-mount zebrafish hearts from 48 to 119 hpf. Wwtr1 is predominantly localized in the nucleus in some ventricular cardiomyocytes (green arrowheads) and moderately expressed in some epicardial cells (yellow arrowhead), but absent from endocardial cells. During trabeculation, some cardiomyocytes delaminate from the compact layer and exhibit weaker nuclear staining for Wwtr1 compared with adjacent compact layer cardiomyocytes (green arrows and Fig. S1B). Nuclei are counterstained with DAPI and cardiomyocyte membranes are marked with myl7:mKate-CAAX expression. Scale bars: 50 μm; 15 μm (insets). V, ventricle; At, atrium. 30-72 hpf, n>3. 96 and 119 hpf, n=2. |
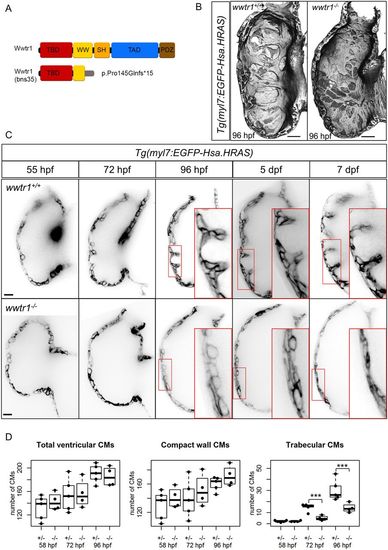
wwtr1 mutant hearts do not develop trabecular ridges. (A) Schematic of wild-type and predicted truncation of Wwtr1 due to a CRISPR-induced out-of-frame insertion (see Materials and Methods). (B) 3D surface reconstruction of ventricular chambers at 96 hpf shows distinct and prominent muscular ridges in wwtr1+/+ (8/8) and wwtr1+/− (7/7), but not wwtr1−/− (20/24), hearts. Scale bars: 15 μm. (C) Confocal sagittal sections of wild-type and wwtr1−/− ventricular chambers of the same animal from 55 hpf to 7 dpf. Scale bars: 15 μm. (D) Longitudinal quantification of the number of ventricular cardiomyocytes (CMs) from five wwtr1+/− and four wwtr1−/− hearts. The total number of ventricular CMs is divided into two groups: compact wall CMs and trabecular CMs. Each point represents a heart. ***P<0.001 by Poisson regression. The box covers the inter-quartile range (IQR); the whiskers cover the first and last quartile of the data. Data points outside the whiskers are outliers (>1.5×IQR from the first and third quartile). |
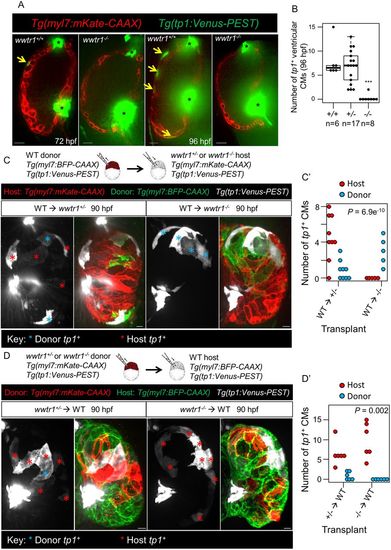
Wwtr1 functions cell-autonomously in cardiomyocytes to regulate tp1 Notch reporter expression. (A) Confocal sagittal sections of representative ventricular chambers at 72 and 96 hpf. Yellow arrows indicate cardiomyocytes expressing the tp1 Notch reporter. The out of focus green signal is from endocardial cells at the valve regions (asterisks). Scale bars: 15 μm. (B) Number of tp1+ ventricular cardiomyocytes at 96 hpf. Each point represents a heart. ***P<0.001 by Poisson regression. (C,D) Maximum intensity projections of hearts derived from transplanting wild-type cells into wwtr1+/− or wwtr1−/− hosts (C), and vice versa (D). Scale bars: 10 μm. (C′,D′) Number of tp1+ donor and host cardiomyocytes (CMs) according to the respective transplantation schemes, as indicated on the x-axis. Each point represents a heart. P-values were calculated using an exact Binomial test. The box covers the inter-quartile range (IQR); the whiskers cover the first and last quartile of the data. Data points outside the whiskers are outliers (>1.5×IQR from the first and third quartile). |
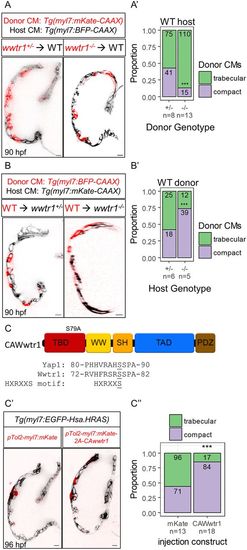
Preference for wwtr1 mutant cardiomyocytes to enter the trabecular layer in wild-type hearts. Confocal sagittal or transverse (WT→wwtr1−/−) sections of mosaic hearts derived from transplanting wwtr1+/− or wwtr1−/− cells into wild-type hosts (A), and vice versa (B). Scale bars: 10 μm. (A′,B′) Proportion and number of donor cardiomyocytes contributing to the trabecular (green) or compact (purple) layers. Detailed quantification can be found in Fig. S6A,B. ***P<0.001 by exact Binomial test. (C) S79A substitution in Wwtr1 results in a constitutively active Wwtr1 protein (CAWwtr1). Peptide alignment of Wwtr1 to Yap1 surrounding the HXRXXS motif corresponding to S87 of Yap1. (C′) Confocal mid-sagittal sections of hearts from wild-type larvae injected with myl7:mKate (control) or myl7:mKate-2A-CAwwtr1 plasmids. Scale bars: 10 μm. (C″) Proportion and number of cardiomyocytes positive for mKate or CAWwtr1 found in the trabecular (green) or compact (purple) layers. Detailed quantification can be found in Fig. S6C. ***P<0.001 by exact Binomial test. |
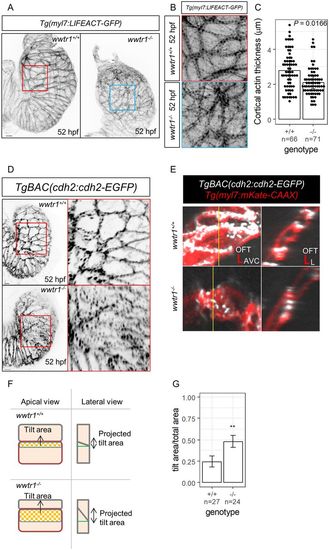
Disruptions to the architecture of the compact wall myocardium in wwtr1−/− hearts. (A) Maximum intensity projections of 52 hpf zebrafish hearts showing the overall expression pattern of LIFEACT-GFP, which marks F-actin localization (8/8 wwtr1+/+ and 6/7 wwtr1−/− hearts). Scale bars: 10 μm. (B) Apical views of cardiomyocytes corresponding to the area demarcated in their respective boxes in A. (C) Quantification of cortical actin thickness in ventricular cardiomyocytes. Each dot represents a cortical actin bundle (n cortical actin bundles were assessed from six wwtr1+/+ and seven wwtr1−/− hearts). P-value was calculated using a two-sample t-test. (D) Maximum intensity projections of 52 hpf zebrafish hearts showing the distribution of N-cadherin-GFP in ventricular cardiomyocytes. Nine out of 11 wwtr1+/+ hearts exhibit distinct N-cadherin-GFP localization to cardiomyocyte junctions, whereas 11/15 wwtr1−/− hearts exhibit punctate distribution of N-cadherin-GFP. Scale bars: 10 μm. (E) Apical views of cardiomyocytes and optical cross-section corresponding to the yellow vertical lines. The N-cadherin-GFP distribution in wwtr1−/− cardiomyocytes appears punctate along the cell junctions and the lateral contacts appear oblique to the apical surface (or ‘tilted’). OFT, outflow tract; AVC, atrioventricular canal; L, lumen. (F) Schematic illustration of E and strategy to quantify the ‘tilting’ of lateral contacts. The rectangle outlined in red is the ‘total area’, whereas the inner rectangle outlined in blue is the ‘tilt area’. The green horizontal line in the ‘lateral view’ is perpendicular to the apical surface. (G) Proportion of ‘tilt area’ to ‘total area’ of ventricular cardiomyocytes (n=total number of cardiomyocytes assessed from four hearts of each genotype). Error bars are one unit of standard deviation. **P<0.01 by two-sample t-test. |
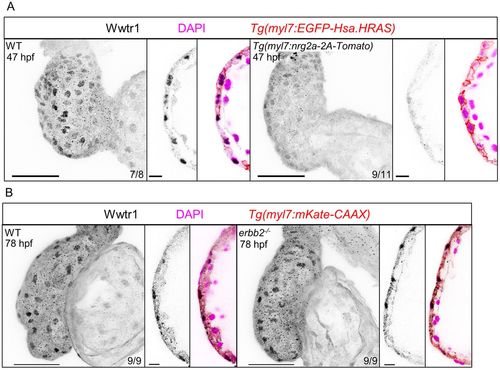
Regulation of Wwtr1 localization by neuregulin signaling. (A) Maximum intensity projections of whole hearts and single confocal sections of the ventricular outer curvature at 47 hpf. Wwtr1 immunostaining was performed on Tg(myl7:nrg2a-2A-Tomato) embryos and their non-transgenic siblings as control (wild type). (B) Maximum intensity projections of whole hearts and single confocal sections of the ventricular outer curvature at 78 hpf. Wwtr1 immunostaining was performed on erbb2 mutant larvae and their wild-type siblings. Scale bars: 50 μm; 10 μm (sections). EXPRESSION / LABELING:
PHENOTYPE:
|
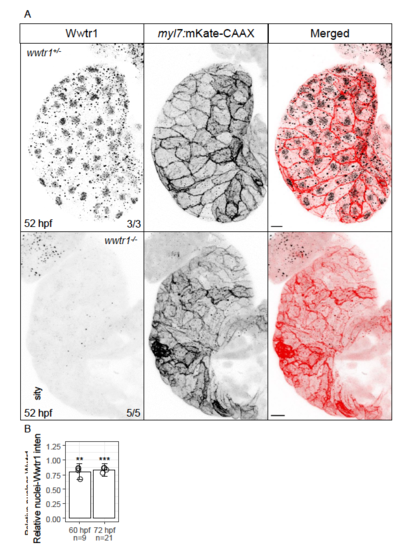
Antibody against human WWTR1 appears to be specific for zebrafish Wwtr1. (A) Maximum intensity projections of cardiac ventricles stained for Wwtr1. Punctae observed in wwtr1-/- samples are non-specific signal. Scale bars, 10 μm. Other groups have also shown that this antibody is specific for zebrafish Wwtr1 in other tissues (Miesfeld et al., 2015; Kimelman et al., 2017). (B) Quantification of Wwtr1 staining intensity in the nuclei of trabecular cardiomyocytes relative to the nuclei of adjacent compact cardiomyocytes at 60 and 72 hpf. ‘n’ number of trabecular cardiomyocyte nuclei were measured from 4 hearts at each time point. Error bars are one unit of standard deviation. ** - P < 0.01; *** - P < 0.001 by two-sample t-test. |

Reduction in the number of EdU+ cardiomyocytes in wwtr1-/-hearts at 96 hpf. 96 hpf WT (A) and mutant (B) heats stained for EdU after 16 hours of incubation (80-96 hpf). myl7:EGFP-Hsa.HRAS and myl7:nlsDsRed expression lavel cardiomyocyte membranes and nuclei, respectively. Yellow arrows point to EdU+ compact layer cardiomyocytes. Yellow arrowheads point to EdU+ trabecular layer cardiomyocytes. Scale bar, 20 μm. (C) Quantification of EdU+ cardiomyocytes in the outer curvature of the ventricle in WT and mutant hearts. (D) Quantification of EdU+ cardiomyocytes in the compact and trabecular layers in WT and mutant hearts. Error Bars are one unit of standard deviation . P-Values were calculated by Student's t-test. |

Number of cardiomyocytes undergoing apical constriction and morphology of trabecular cardiomyocytes. (A) Confocal mid-sagittal sections of 79 hpf hearts showing cardiomyocytes undergoing apical constriction (yellow arrows). Scale bars, 10 μm. (B) Number of cardiomyocytes undergoing apical constriction. Each point represents a heart. (C) Confocal mid-sagittal sections of 96 hpf hearts showing distribution of EGFP-Podxl in cardiomyocytes. Scale bars, 10 μm. (D) Percentage and number of EGFP-Podxl-polarized trabecular cardiomyocytes. ‘n’ number of trabecular cardiomyocytes were assessed from 8 wwtr1+/+, 10 wwtr1+/-, and 9 wwtr1-/- hearts. * - P < 0.05 by exact Binomial test. (E) Maximum projections of 96 hpf hearts. Clusters of trabecular cardiomyocytes (myl7:mKate+) were selected to extract the LIFEACT-GFP channel (shown in insets). Selected clusters of trabecular cardiomyocytes are marked in red in the orthogonal views. 3/3 trabecular cardiomyocytes from 2 wwtr1+/? hearts exhibit tubular morphology and striated cortical actin, and 4/4 trabecular cardiomyocytes from 2 wwtr1-/- hearts exhibit flattened morphology and indistinct cortical actin. Scale bars, 10 μm. |
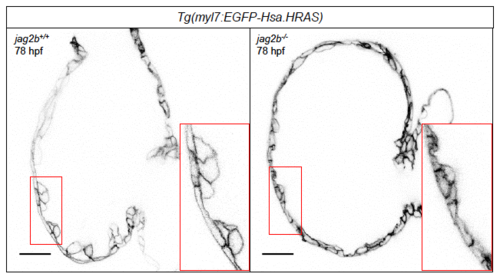
Morphology of jag2b-/- and WT sibling hearts at 78 hpf. Optical cross sections reveal the ventricular wall morphology of 78 hpf WT and jag2b mutant (hu3425) hearts. The transgene marks cardiomyocyte membranes. High magnifications are demarcated in red. Scale bars, 20 μm. |
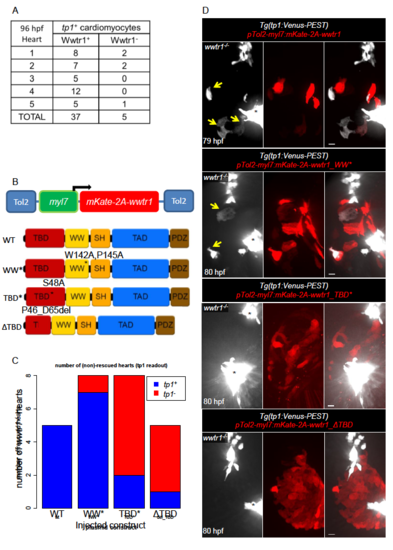
The Tead-binding domain of Wwtr1 is required for cardiomyocyte expression of the tp1 Notch reporter. (A) Quantification of nuclei of tp1+ cardiomyocytes exhibiting Wwtr1 nuclear localization (Wwtr1+) or not (Wwtr1-). (B) Schematic of constructs to express mKate and Wwtr1, connected by a self-cleavable 2A peptide, under the myl7 promoter. WT wwtr1 was substituted with different variants in the WW domain (WW*: W142A, P145A) and Tead-binding domain (TBD*: S48A; ΔTBD: P46_D65del). (C) Quantification of tp1+ and tp1- wwtr1-/- hearts after injection with the constructs shown on the x-axis. tp1+ mutant hearts show at least one double-labeled cardiomyocyte (i.e. tp1+ and mKate+). (D) Representative maximum intensity projections of wwtr1-/- hearts after injection with the constructs shown in (A). Yellow arrows point to tp1+ cardiomyocytes. The out of focus white signal is from endocardial cells at the valve regions (black asterisks). Scale bars, 10 μm. |
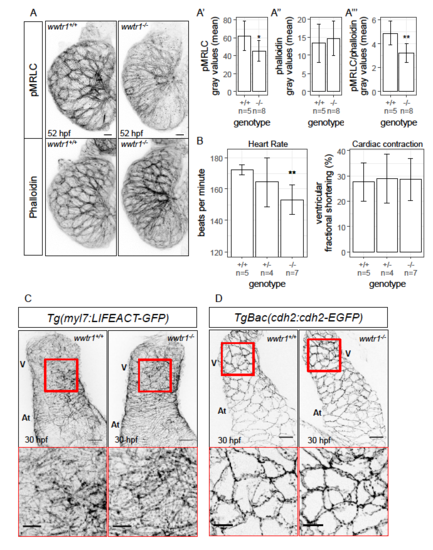
wwtr1-/- hearts exhibit decreased immunostaining intensity for phospho- MRLC and lower heart rate. (A) Maximum intensity projections of whole mount zebrafish hearts showing phospho-MRLC (pMRLC) and phalloidin stainings. Scale bars, 10 μm. The gray values of pMRLC are normalized to the gray values of phalloidin to correct for technical noise. Quantification of the mean pMRLC gray values (A’), mean phalloidin gray values (A’’), and normalized mean gray values of pMRLC (A’’’). Error bars are one unit of standard deviation. * - P < 0.05; ** - P < 0.01 by two-sample t-test. (B) Quantification of heart rate and ventricular fractional shortening at 52 hpf. Movies of beating hearts can be found in Movie S1. Error bars are one unit of standard deviation. ** - P < 0.01 by linear regression. (C) Maximum intensity projections of whole mount 30 hpf zebrafish hearts showing the expression pattern of LIFEACT-GFP in cardiomyocytes. Insets (demarcated in red) show high magnification views. The cardiomyocyte LIFEACT-GFP expression pattern is similar between wwtr1+/+ (n = 5) and wwtr1-/- (n = 6) hearts at this stage. (D) Maximum intensity projections of whole mount 30 hpf zebrafish hearts showing the N-cadherin-GFP localization in cardiomyocytes. Insets (demarcated in red) show high magnification views. The Ncadherin- GFP localization in cardiomyocytes is similar between wwtr1+/+ (n = 8) and wwtr1-/- (n = 7) hearts at this stage. Scale bars, 20 μm; 10 μm (insets). V - Ventricle; At - Atrium. |

Apico-basal polarity of cardiomyocytes prior to trabeculation. Mid-sagittal sections of 52 hpf zebrafish hearts showing correct localization of EGFP-Podxl and Mark3atagRFP on the apical and basal domains, respectively, of cardiomyocytes in both wwtr1+/+ and wwtr1-/- hearts. Scale bars, 10 μm. |
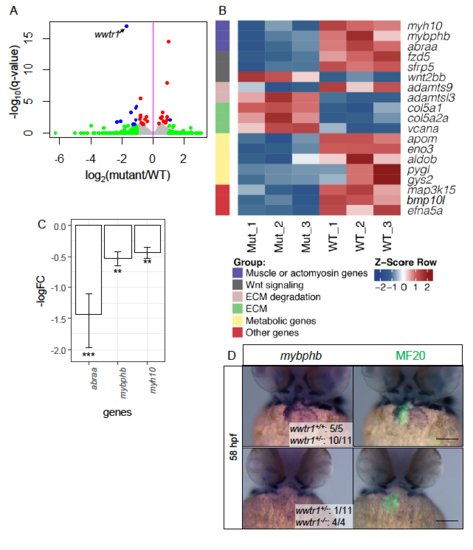
Transcriptomic analyses of wwtr1-/- hearts compared to wwtr1+/+ hearts at 57- 59 hpf. (A) Volcano plot comparing the transcriptomes of wwtr1-/- to wwtr1+/+ sibling hearts collected at 57 – 59 hpf. As expected, wwtr1 is significantly downregulated in wwtr1-/- hearts. Each point represents a gene. Blue points are genes that are significantly differentially expressed; red points are genes that are moderately differentially expressed; green points are genes not significantly differentially expressed (see Materials and Methods for thresholds). (B) Heat map of z-scores of selected significantly differentially expressed genes assigned to functional categories. (C) Significantly differentially expressed genes that regulate muscle maturation and actin dynamics. Error bars are one unit of standard deviation from three RNAseq biological replicates of each genotype. ** - adjusted P < 0.01; *** - adjusted P < 0.001 calculated by DESEQ2. (D) Whole mount in situ hybridization for mybphb expression counterstained with MF20 reveals cardiac-specific loss of mybphb expression in wwtr1-/- hearts. |
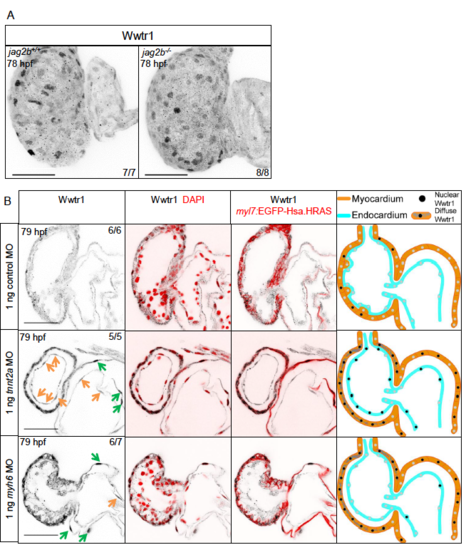
Regulation of Wwtr1 localization by cardiac contractility. (A) Maximum intensity projections of 78 hpf hearts. Immunostaining for Wwtr1 was performed on jag2b mutant larvae and their WT siblings. (B) Confocal sections of 79 hpf hearts. Immunostaining for Wwtr1 was performed on tnnt2a, myh6 and control morphants. Orange arrows point to nuclei of endocardial cells exhibiting nuclear Wwtr1 expression. Green arrows point to nuclei of atrial cardiomyocytes exhibiting nuclear Wwtr1 expression. Scale bars, 50 μm. |